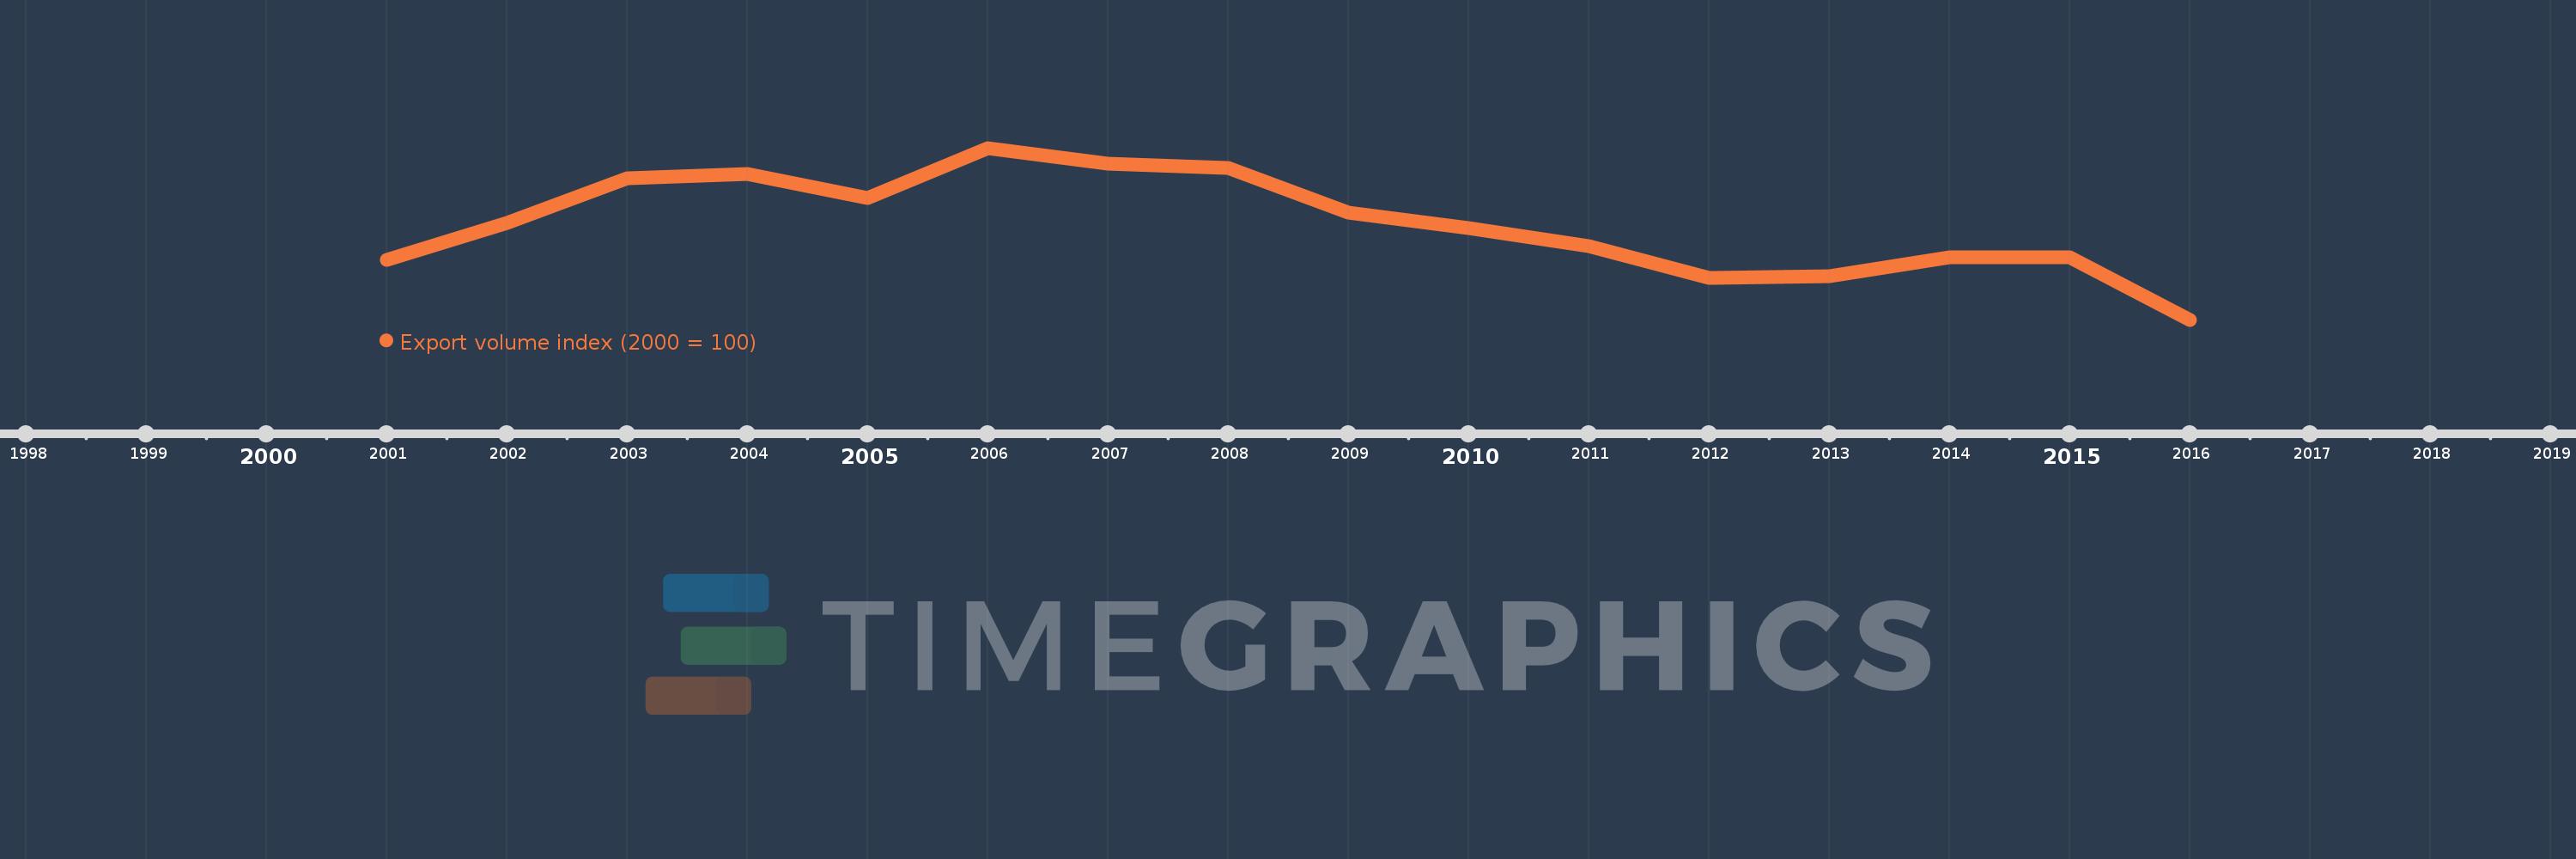
This timeline shows a graph from 2001 to 2016 of British Virgin Islands. No data until 2000. Number of actual observations by date: 16.
Source name:
World Development Indicators
Source organization:
United Nations Conference on Trade and Development, Handbook of Statistics and data files, and International Monetary Fund, International Financial Statistics.
Categories, topics:
Private Sector, Trade
Last updated:
apr 23, 2017
Indicators value changes by year
Meaning:
109.96
Minimum:
83.296
jan 1, 2016
Maximum:
131.247
jan 1, 2006
At the date of observation
Value
Absolute change
Change from the previous value
jan 1, 2001
100.0
+100.0
0.0%
jan 1, 2002
110.252
+10.252
10.25%
jan 1, 2003
122.898
+12.646
11.47%
jan 1, 2004
124.065
+1.168
0.95%
jan 1, 2005
117.324
-6.742
-5.43%
jan 1, 2006
131.247
+13.923
11.87%
jan 1, 2007
126.837
-4.409
-3.36%
jan 1, 2008
125.652
-1.185
-0.93%
jan 1, 2009
113.235
-12.417
-9.88%
jan 1, 2010
108.869
-4.366
-3.86%
jan 1, 2011
103.774
-5.095
-4.68%
jan 1, 2012
94.902
-8.872
-8.55%
jan 1, 2013
95.382
+0.48
0.51%
jan 1, 2014
100.789
+5.407
5.67%
jan 1, 2015
100.833
+0.044
0.04%
jan 1, 2016
83.296
-17.537
-17.39%
Ranking of countries by current statistics by years