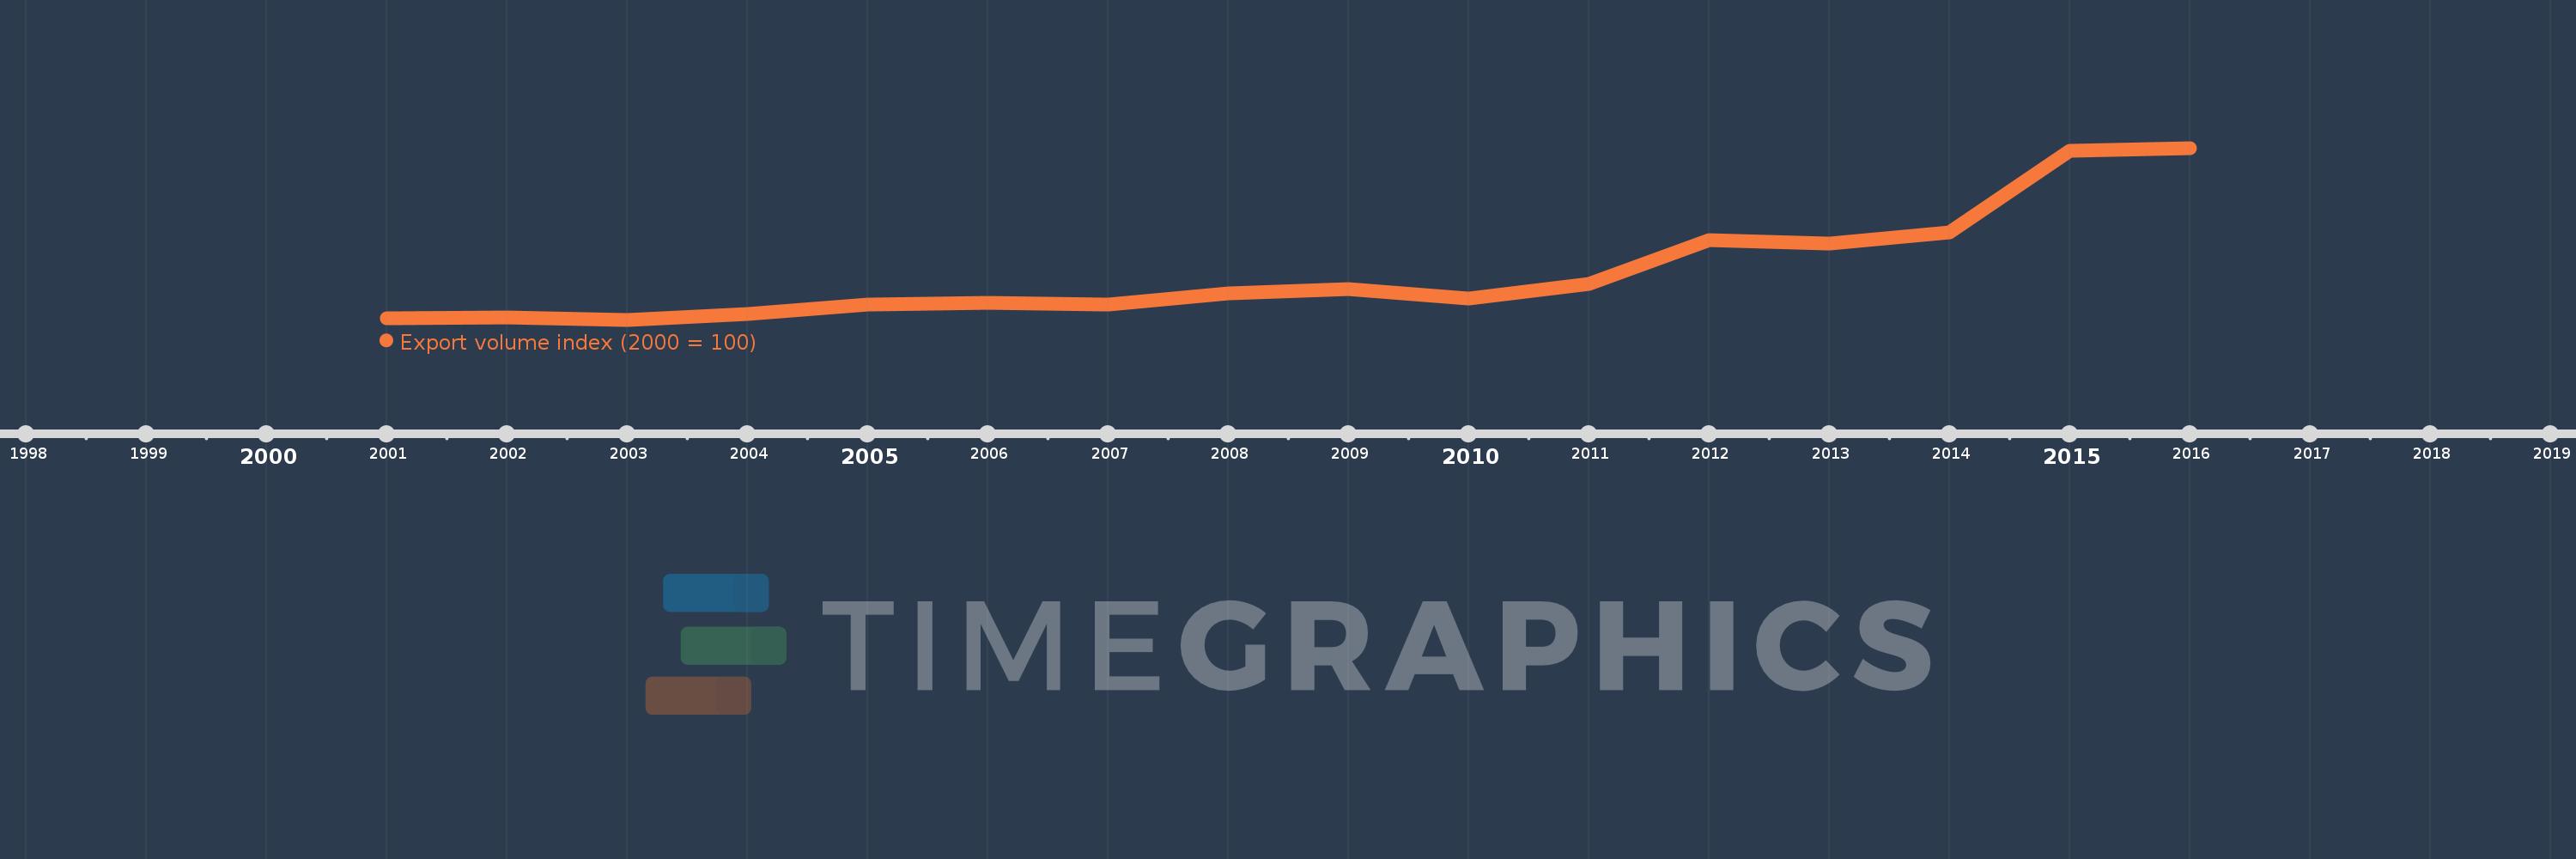
This timeline shows a graph from 2001 to 2016 of Mongolia. No data until 2000. Number of actual observations by date: 16.
Source name:
World Development Indicators
Source organization:
United Nations Conference on Trade and Development, Handbook of Statistics and data files, and International Monetary Fund, International Financial Statistics.
Categories, topics:
Private Sector, Trade
Last updated:
apr 23, 2017
Indicators value changes by year
Meaning:
159.116
Minimum:
97.784
jan 1, 2003
Maximum:
321.225
jan 1, 2016
At the date of observation
Value
Absolute change
Change from the previous value
jan 1, 2001
100.0
+100.0
0.0%
jan 1, 2002
100.688
+0.688
0.69%
jan 1, 2003
97.784
-2.904
-2.88%
jan 1, 2004
105.076
+7.292
7.46%
jan 1, 2005
117.147
+12.071
11.49%
jan 1, 2006
120.098
+2.951
2.52%
jan 1, 2007
118.074
-2.025
-1.69%
jan 1, 2008
131.565
+13.491
11.43%
jan 1, 2009
137.833
+6.269
4.76%
jan 1, 2010
125.291
-12.542
-9.1%
jan 1, 2011
144.627
+19.336
15.43%
jan 1, 2012
201.013
+56.387
38.99%
jan 1, 2013
197.381
-3.633
-1.81%
jan 1, 2014
210.942
+13.561
6.87%
jan 1, 2015
317.118
+106.176
50.33%
jan 1, 2016
321.225
+4.107
1.29%
Ranking of countries by current statistics by years