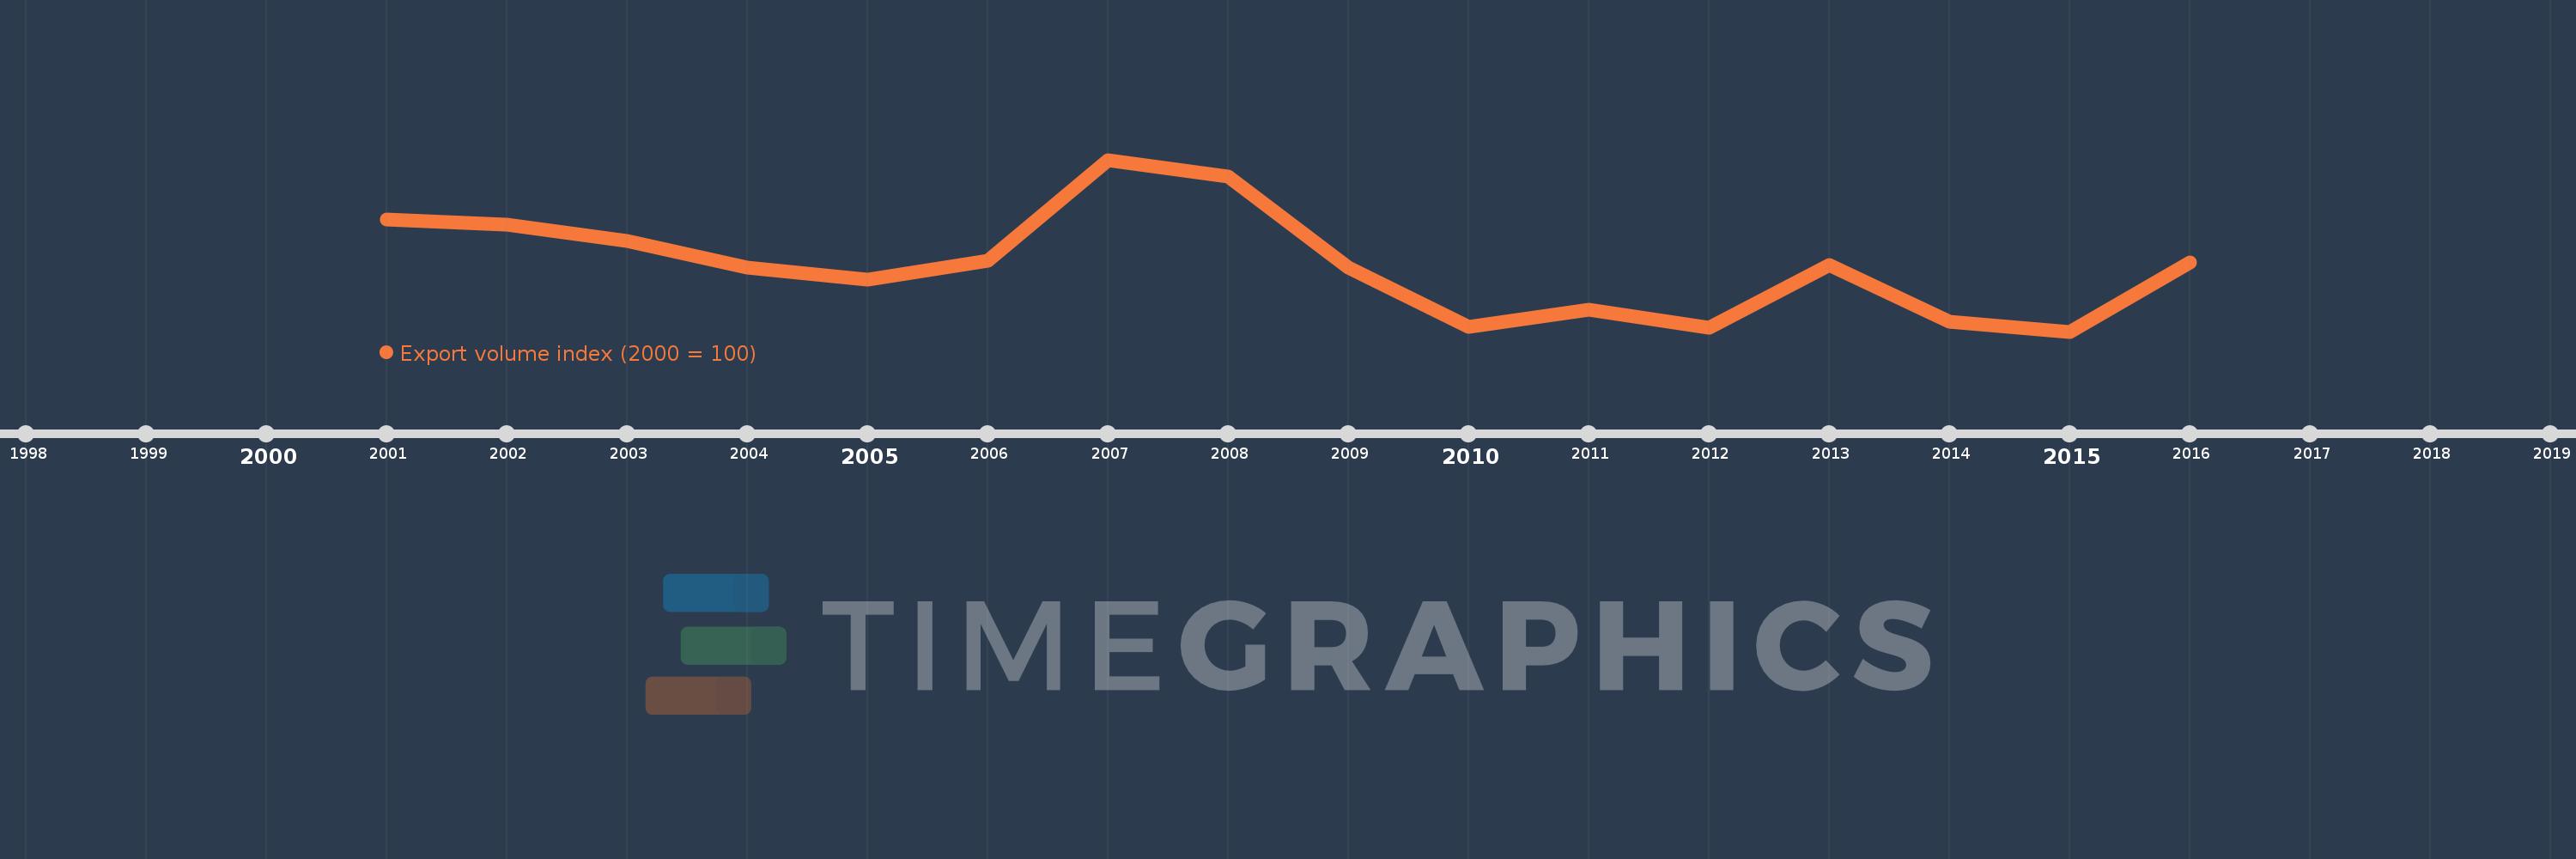
This timeline shows a graph from 2001 to 2016 of Barbados. No data until 2000. Number of actual observations by date: 16.
Source name:
World Development Indicators
Source organization:
United Nations Conference on Trade and Development, Handbook of Statistics and data files, and International Monetary Fund, International Financial Statistics.
Categories, topics:
Private Sector, Trade
Last updated:
apr 23, 2017
Indicators value changes by year
Meaning:
88.645
Minimum:
72.17
jan 1, 2015
Maximum:
114.725
jan 1, 2007
At the date of observation
Value
Absolute change
Change from the previous value
jan 1, 2001
100.0
+100.0
0.0%
jan 1, 2002
98.746
-1.254
-1.25%
jan 1, 2003
94.661
-4.084
-4.14%
jan 1, 2004
87.916
-6.746
-7.13%
jan 1, 2005
84.975
-2.941
-3.35%
jan 1, 2006
89.672
+4.697
5.53%
jan 1, 2007
114.725
+25.053
27.94%
jan 1, 2008
110.552
-4.173
-3.64%
jan 1, 2009
88.102
-22.45
-20.31%
jan 1, 2010
73.343
-14.759
-16.75%
jan 1, 2011
77.654
+4.311
5.88%
jan 1, 2012
73.116
-4.537
-5.84%
jan 1, 2013
88.686
+15.57
21.29%
jan 1, 2014
74.619
-14.067
-15.86%
jan 1, 2015
72.17
-2.45
-3.28%
jan 1, 2016
89.378
+17.208
23.84%
Ranking of countries by current statistics by years