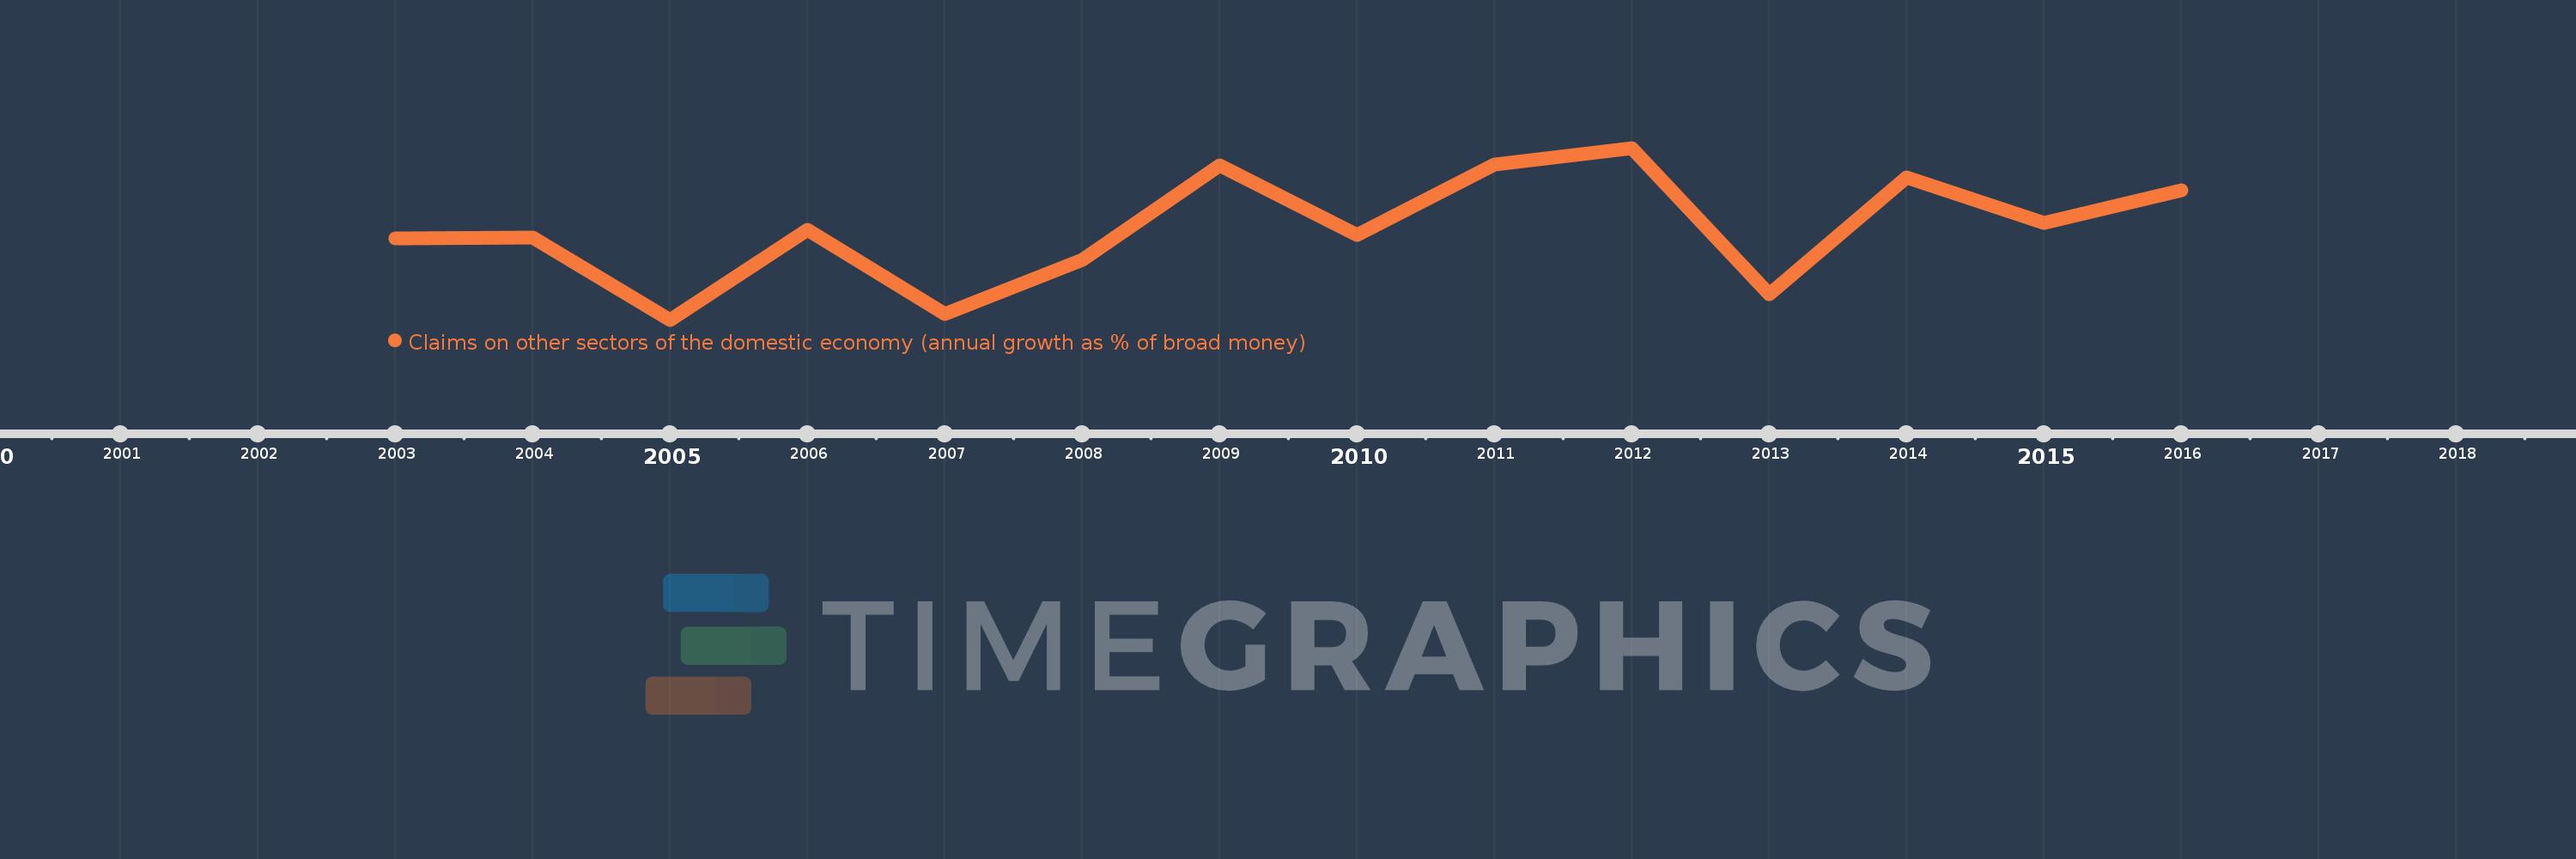
Questa scala temporale mostra un grafico dal 2003 anno al 2016 anno. Cameroon. I dati fino ad 2002 anno non disponibili. Il numero di osservazioni attuali secondo i date: 14.
La fonte (nome):
Indicatori dello sviluppo mondiale
La fonte (organizzazione):
International Monetary Fund, International Financial Statistics and data files.
Categorie:
Financial Sector
sono stati aggiornati
23 apr 2017 anni
Indicatori delle variazioni dei valori per anni
In media:
7.384
Minima:
0.008
1 gen 2005 anni
Massimo:
13.88
1 gen 2012 anni
Alla data di osservazione
Valore
Variazione assoluta
La variazione rispetto al valore precedente
1 gen 2003 anni
6.595
+6.595
0.0%
1 gen 2004 anni
6.653
+0.059
0.89%
1 gen 2005 anni
0.008
-6.646
-99.88%
1 gen 2006 anni
7.239
+7.231
91.99 Mille.%
1 gen 2007 anni
0.473
-6.765
-93.46%
1 gen 2008 anni
4.838
+4.364
922.12%
1 gen 2009 anni
12.442
+7.604
157.19%
1 gen 2010 anni
6.873
-5.569
-44.76%
1 gen 2011 anni
12.516
+5.643
82.1%
1 gen 2012 anni
13.88
+1.364
10.9%
1 gen 2013 anni
2.096
-11.783
-84.9%
1 gen 2014 anni
11.469
+9.373
447.14%
1 gen 2015 anni
7.821
-3.648
-31.81%
1 gen 2016 anni
10.473
+2.651
33.9%
Classificazione dei paesi secondo i statistiche attuali per anni