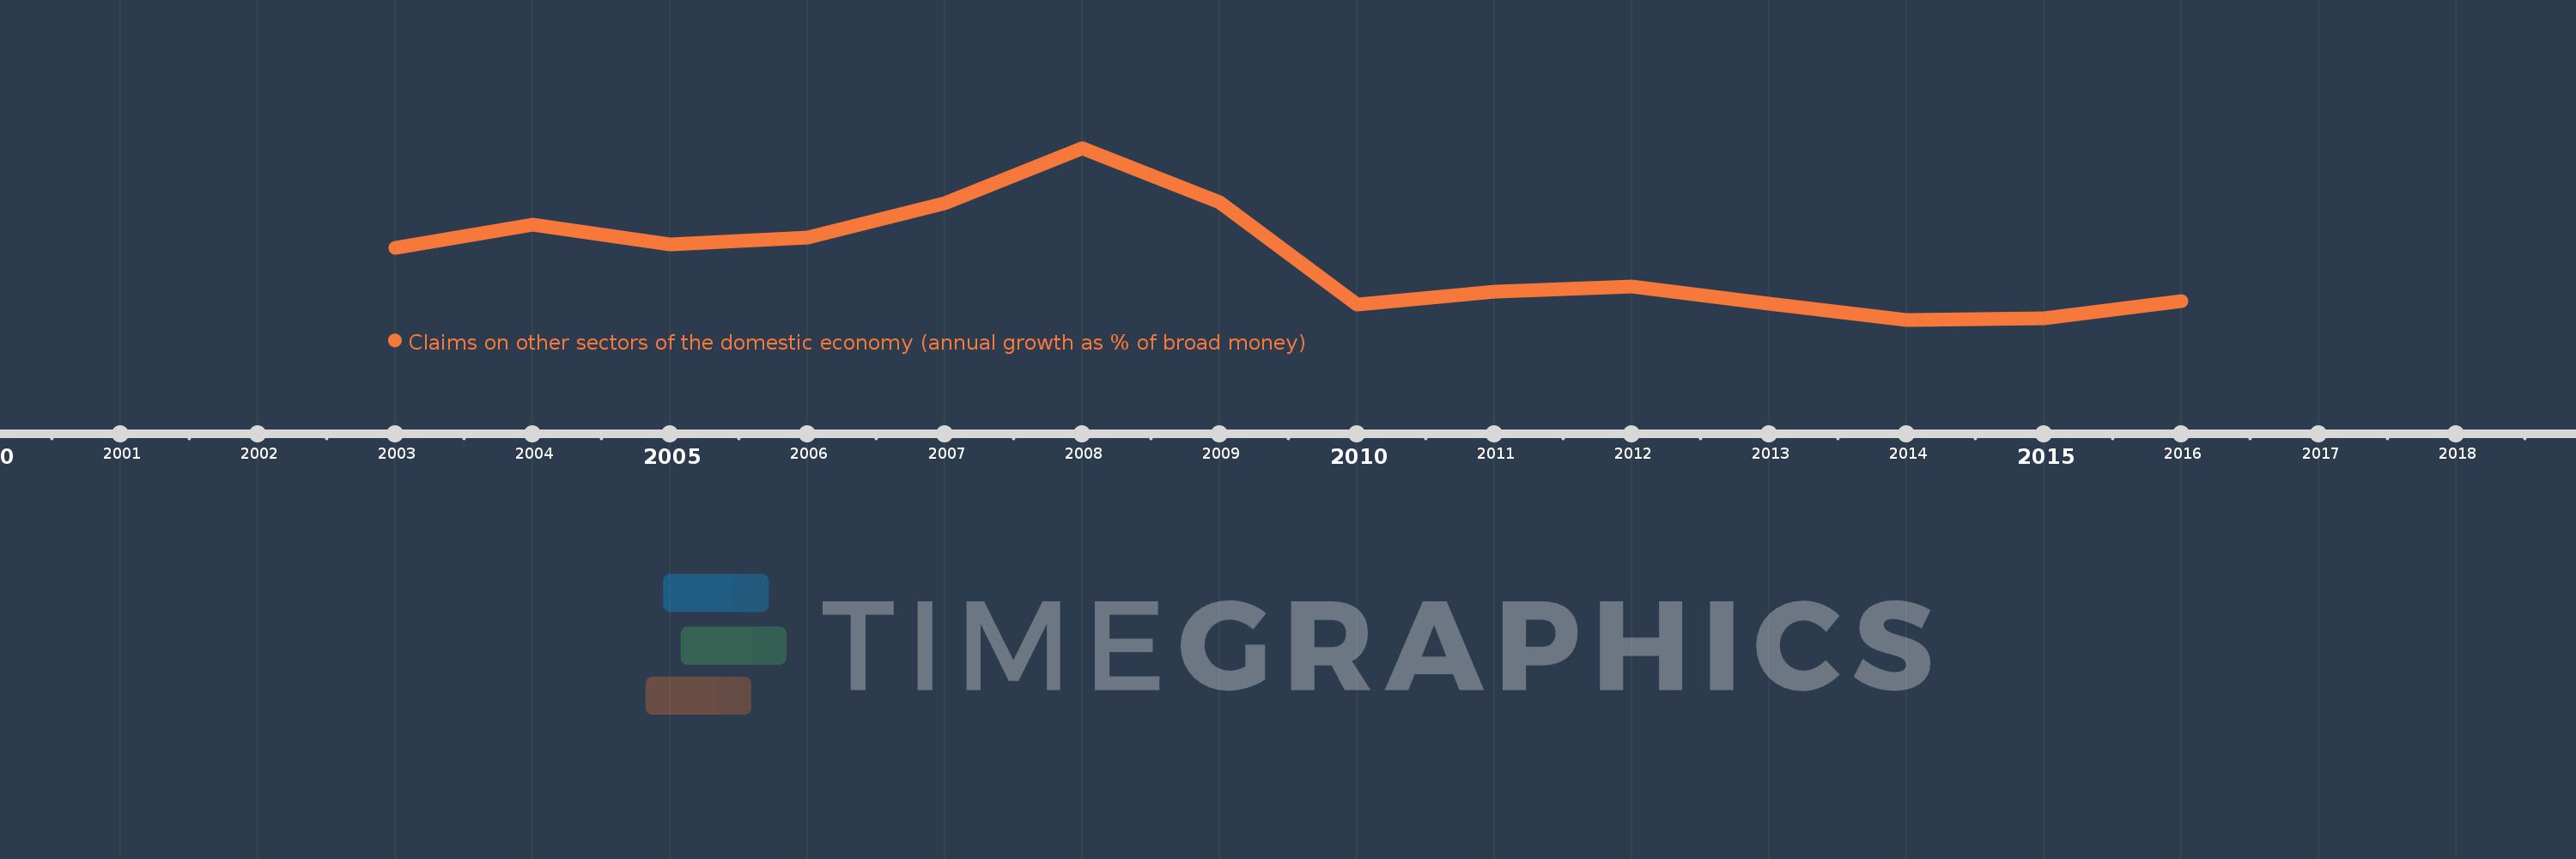
Questa scala temporale mostra un grafico dal 2003 anno al 2016 anno. Romania. I dati fino ad 2002 anno non disponibili. Il numero di osservazioni attuali secondo i date: 14.
La fonte (nome):
Indicatori dello sviluppo mondiale
La fonte (organizzazione):
International Monetary Fund, International Financial Statistics and data files.
Categorie:
Financial Sector
sono stati aggiornati
23 apr 2017 anni
Indicatori delle variazioni dei valori per anni
In media:
16.243
Minima:
-3.186
1 gen 2014 anni
Massimo:
52.275
1 gen 2008 anni
Alla data di osservazione
Valore
Variazione assoluta
La variazione rispetto al valore precedente
1 gen 2003 anni
20.007
+20.007
0.0%
1 gen 2004 anni
27.408
+7.401
36.99%
1 gen 2005 anni
21.075
-6.333
-23.11%
1 gen 2006 anni
23.401
+2.326
11.04%
1 gen 2007 anni
34.511
+11.11
47.48%
1 gen 2008 anni
52.275
+17.764
51.47%
1 gen 2009 anni
34.662
-17.613
-33.69%
1 gen 2010 anni
1.859
-32.803
-94.64%
1 gen 2011 anni
5.779
+3.92
210.88%
1 gen 2012 anni
7.41
+1.631
28.22%
1 gen 2013 anni
2.138
-5.272
-71.15%
1 gen 2014 anni
-3.186
-5.324
-249.06%
1 gen 2015 anni
-2.665
+0.522
-16.37%
1 gen 2016 anni
2.725
+5.39
-202.28%
Classificazione dei paesi secondo i statistiche attuali per anni