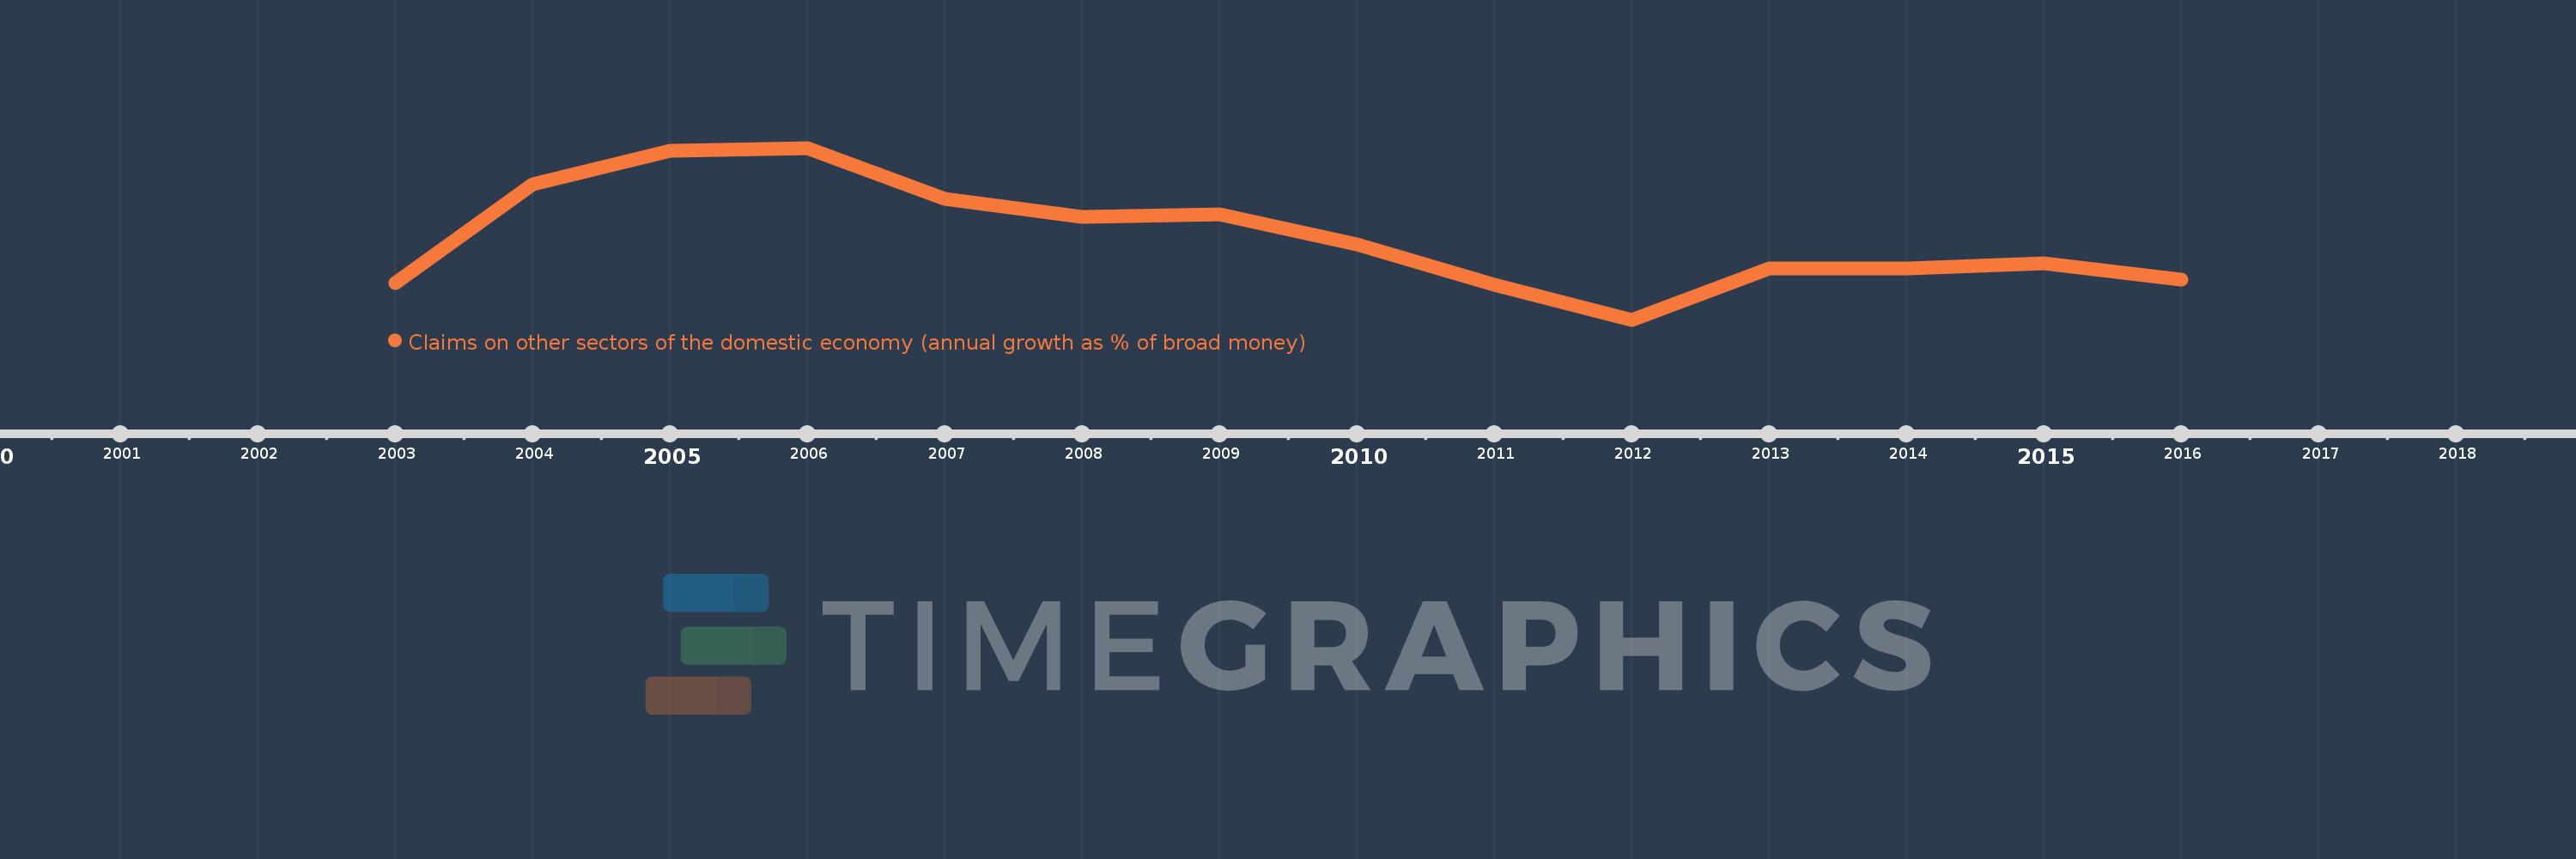
Questa scala temporale mostra un grafico dal 2003 anno al 2016 anno. Pakistan. I dati fino ad 2002 anno non disponibili. Il numero di osservazioni attuali secondo i date: 14.
La fonte (nome):
Indicatori dello sviluppo mondiale
La fonte (organizzazione):
International Monetary Fund, International Financial Statistics and data files.
Categorie:
Financial Sector
sono stati aggiornati
23 apr 2017 anni
Indicatori delle variazioni dei valori per anni
In media:
7.167
Minima:
-2.088
1 gen 2012 anni
Massimo:
17.262
1 gen 2006 anni
Alla data di osservazione
Valore
Variazione assoluta
La variazione rispetto al valore precedente
1 gen 2003 anni
2.009
+2.009
0.0%
1 gen 2004 anni
13.142
+11.133
554.23%
1 gen 2005 anni
16.914
+3.772
28.7%
1 gen 2006 anni
17.262
+0.348
2.06%
1 gen 2007 anni
11.539
-5.723
-33.16%
1 gen 2008 anni
9.475
-2.064
-17.89%
1 gen 2009 anni
9.755
+0.28
2.96%
1 gen 2010 anni
6.404
-3.351
-34.35%
1 gen 2011 anni
1.821
-4.582
-71.56%
1 gen 2012 anni
-2.088
-3.91
-214.65%
1 gen 2013 anni
3.66
+5.748
-275.27%
1 gen 2014 anni
3.706
+0.046
1.25%
1 gen 2015 anni
4.276
+0.57
15.39%
1 gen 2016 anni
2.46
-1.816
-42.46%
Classificazione dei paesi secondo i statistiche attuali per anni