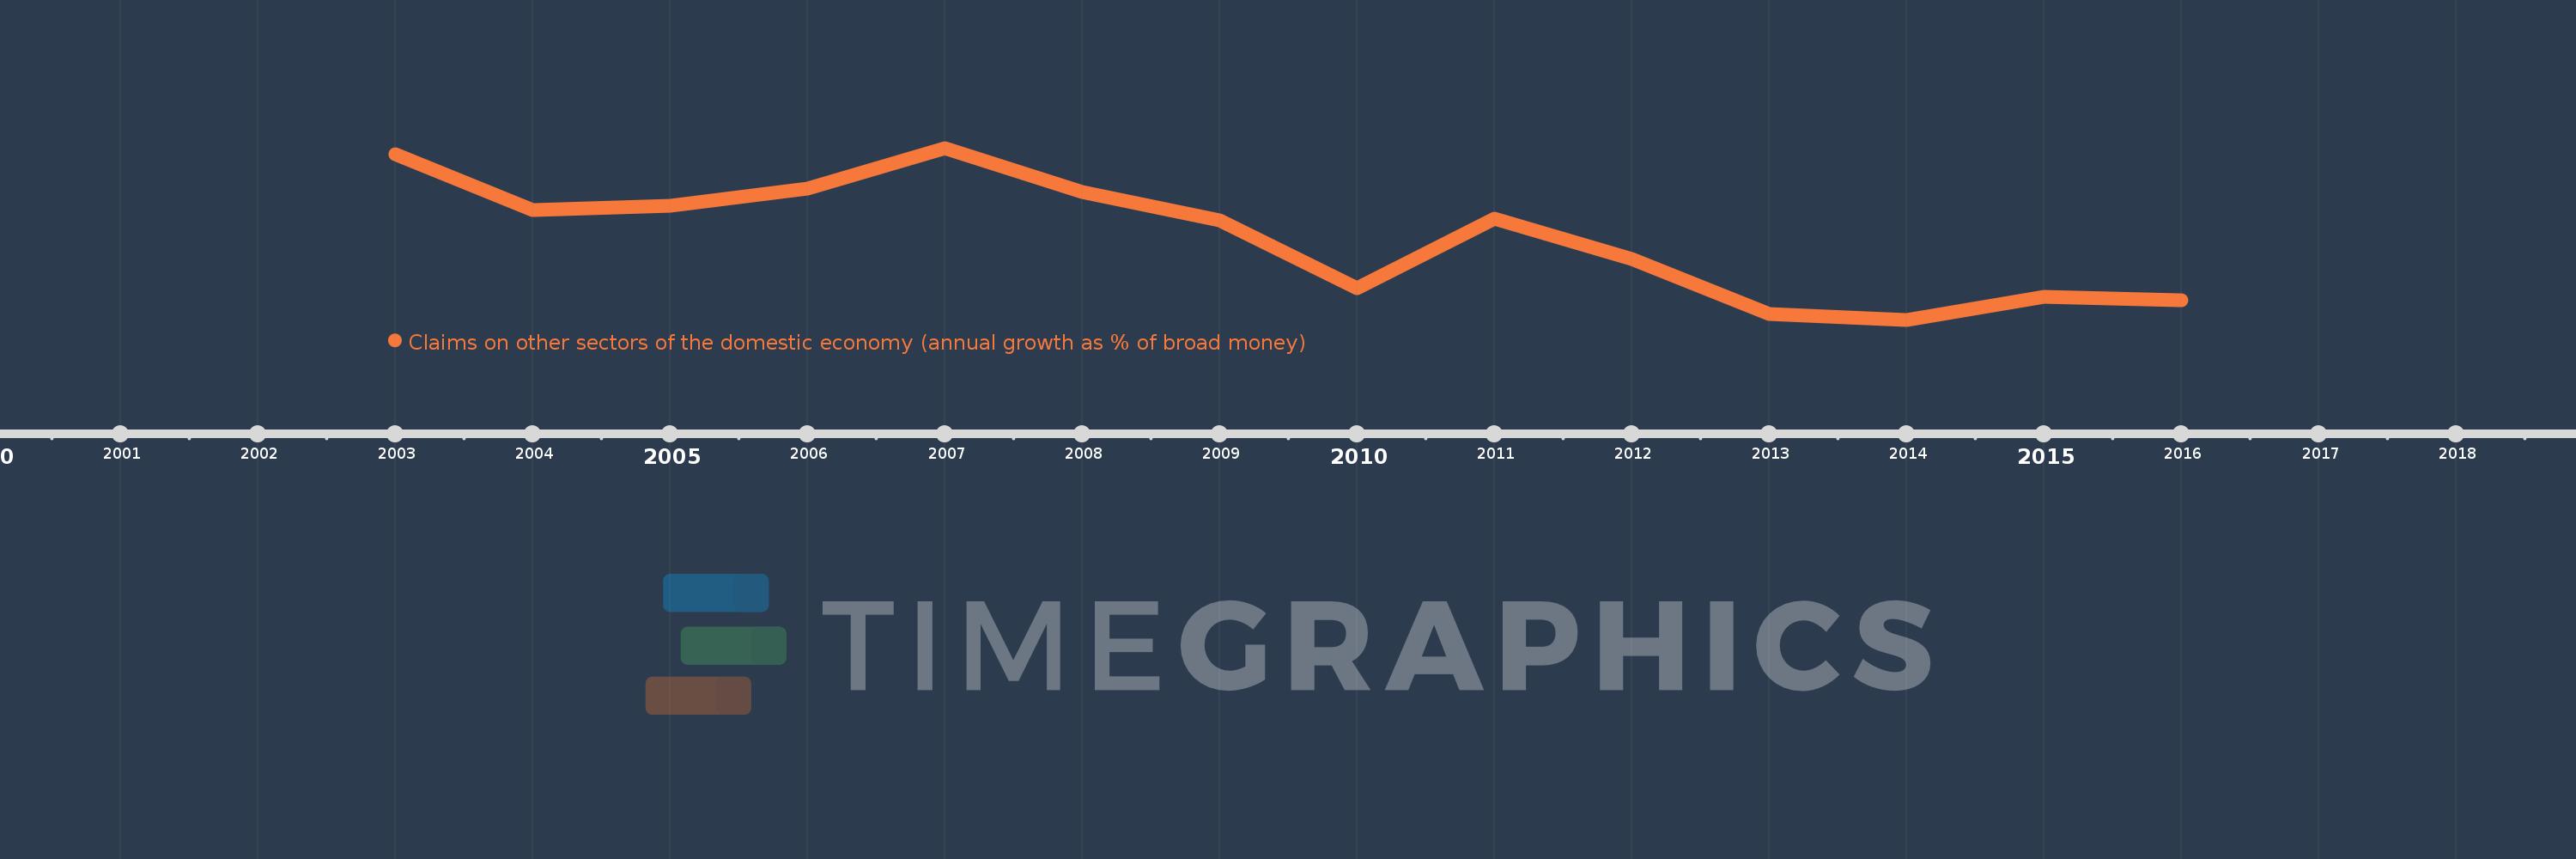
Questa scala temporale mostra un grafico dal 2003 anno al 2016 anno. Croatia. I dati fino ad 2002 anno non disponibili. Il numero di osservazioni attuali secondo i date: 14.
La fonte (nome):
Indicatori dello sviluppo mondiale
La fonte (organizzazione):
International Monetary Fund, International Financial Statistics and data files.
Categorie:
Financial Sector
sono stati aggiornati
23 apr 2017 anni
Indicatori delle variazioni dei valori per anni
In media:
7.738
Minima:
-5.676
1 gen 2014 anni
Massimo:
22.092
1 gen 2007 anni
Alla data di osservazione
Valore
Variazione assoluta
La variazione rispetto al valore precedente
1 gen 2003 anni
21.128
+21.128
0.0%
1 gen 2004 anni
12.087
-9.042
-42.79%
1 gen 2005 anni
12.783
+0.696
5.76%
1 gen 2006 anni
15.537
+2.754
21.55%
1 gen 2007 anni
22.092
+6.555
42.19%
1 gen 2008 anni
14.944
-7.148
-32.36%
1 gen 2009 anni
10.424
-4.52
-30.25%
1 gen 2010 anni
-0.58
-11.004
-105.57%
1 gen 2011 anni
10.713
+11.294
-1.95 Mille.%
1 gen 2012 anni
4.124
-6.59
-61.51%
1 gen 2013 anni
-4.776
-8.9
-215.83%
1 gen 2014 anni
-5.676
-0.9
18.84%
1 gen 2015 anni
-1.937
+3.739
-65.87%
1 gen 2016 anni
-2.526
-0.588
30.37%
Classificazione dei paesi secondo i statistiche attuali per anni