Questa scala temporale mostra un grafico dal 2003 anno al 2016 anno. Antigua and Barbuda. I dati fino ad 2002 anno non disponibili. Il numero di osservazioni attuali secondo i date: 14.
La fonte (nome):
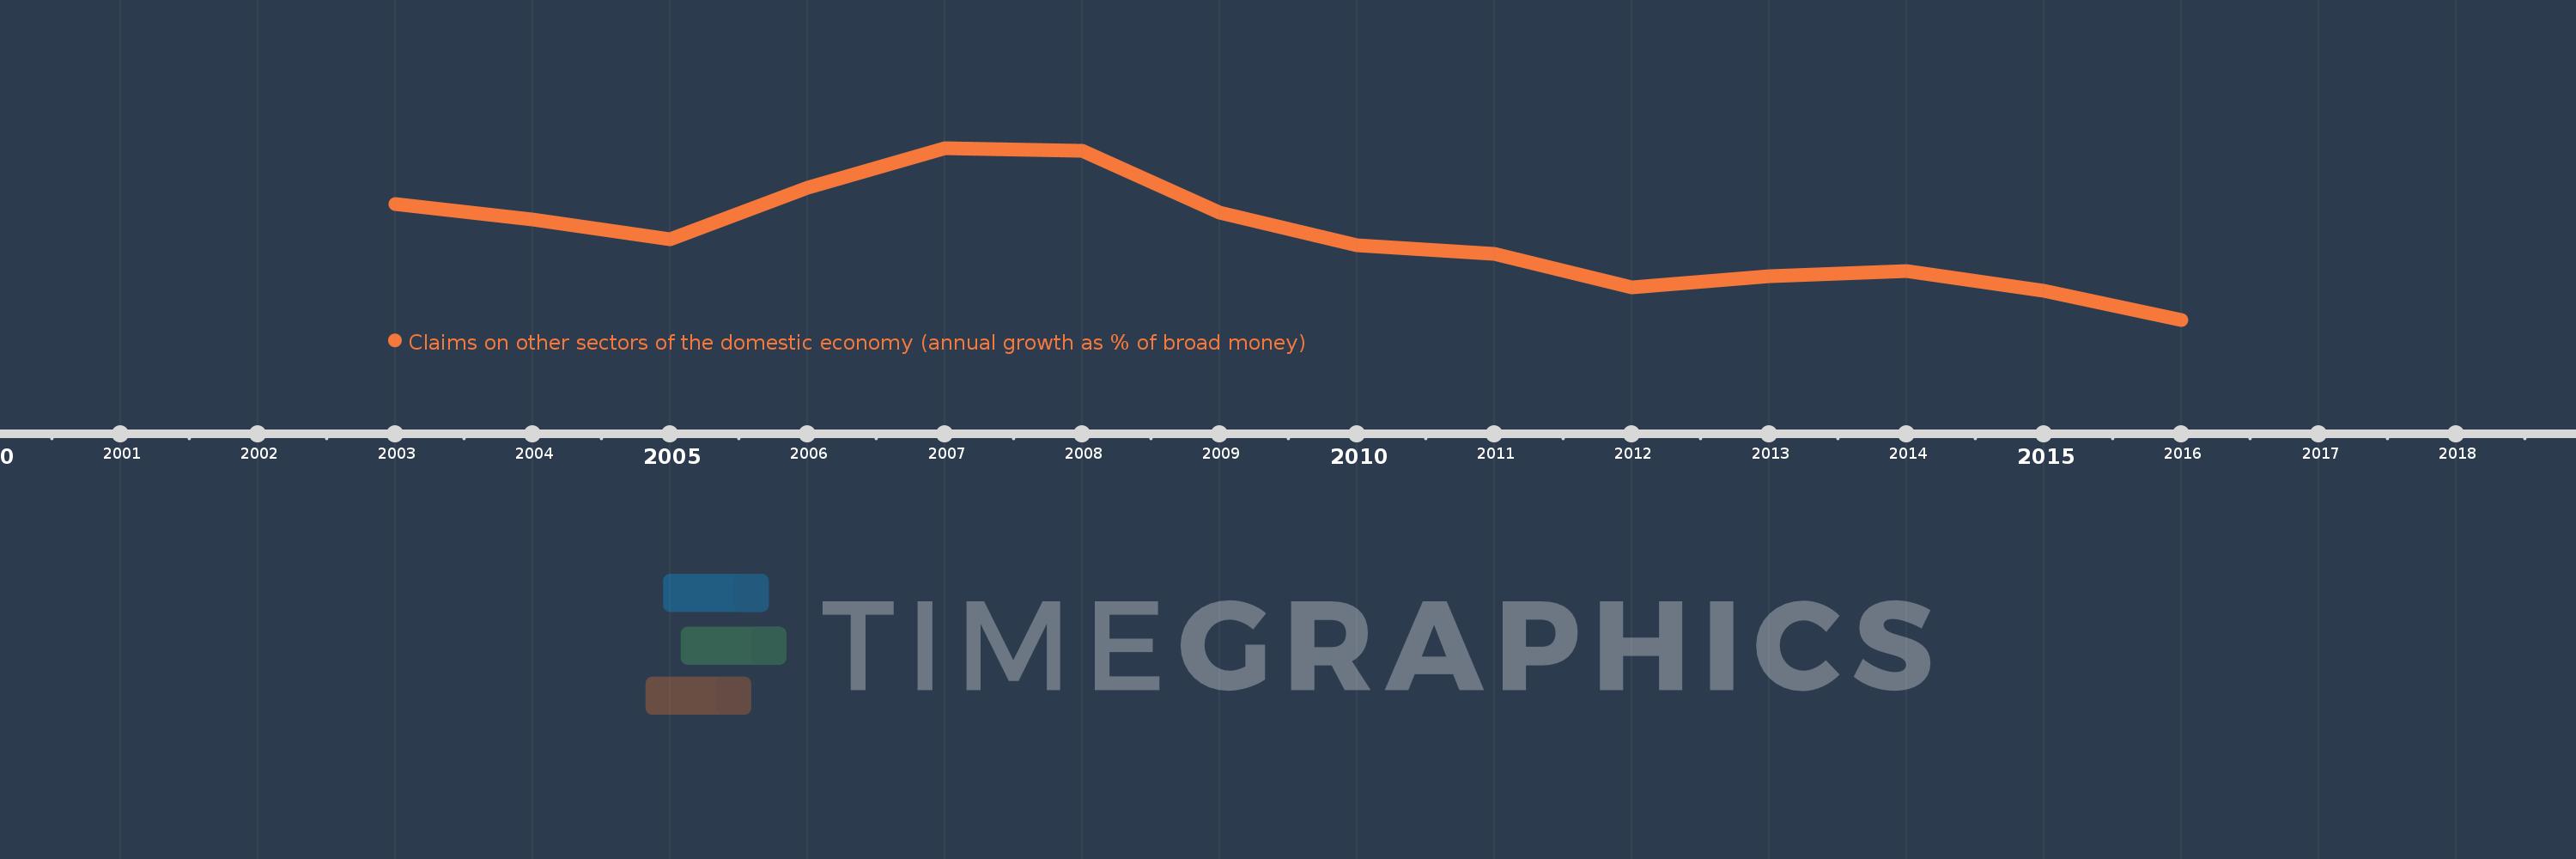
Indicatori dello sviluppo mondiale
La fonte (organizzazione):
International Monetary Fund, International Financial Statistics and data files.
Categorie:
Financial Sector
sono stati aggiornati
23 apr 2017 anni
Indicatori delle variazioni dei valori per anni
In media:
1.988
Minima:
-6.931
1 gen 2016 anni
Massimo:
11.396
1 gen 2007 anni
Alla data di osservazione
Valore
Variazione assoluta
La variazione rispetto al valore precedente
1 gen 2003 anni
5.436
+5.436
0.0%
1 gen 2004 anni
3.747
-1.689
-31.07%
1 gen 2005 anni
1.629
-2.118
-56.52%
1 gen 2006 anni
7.133
+5.504
337.9%
1 gen 2007 anni
11.396
+4.263
59.77%
1 gen 2008 anni
11.099
-0.297
-2.61%
1 gen 2009 anni
4.497
-6.602
-59.48%
1 gen 2010 anni
1.026
-3.472
-77.2%
1 gen 2011 anni
0.124
-0.901
-87.87%
1 gen 2012 anni
-3.448
-3.572
-2.87 Mille.%
1 gen 2013 anni
-2.292
+1.155
-33.51%
1 gen 2014 anni
-1.756
+0.537
-23.41%
1 gen 2015 anni
-3.832
-2.077
118.29%
1 gen 2016 anni
-6.931
-3.098
80.84%
Classificazione dei paesi secondo i statistiche attuali per anni