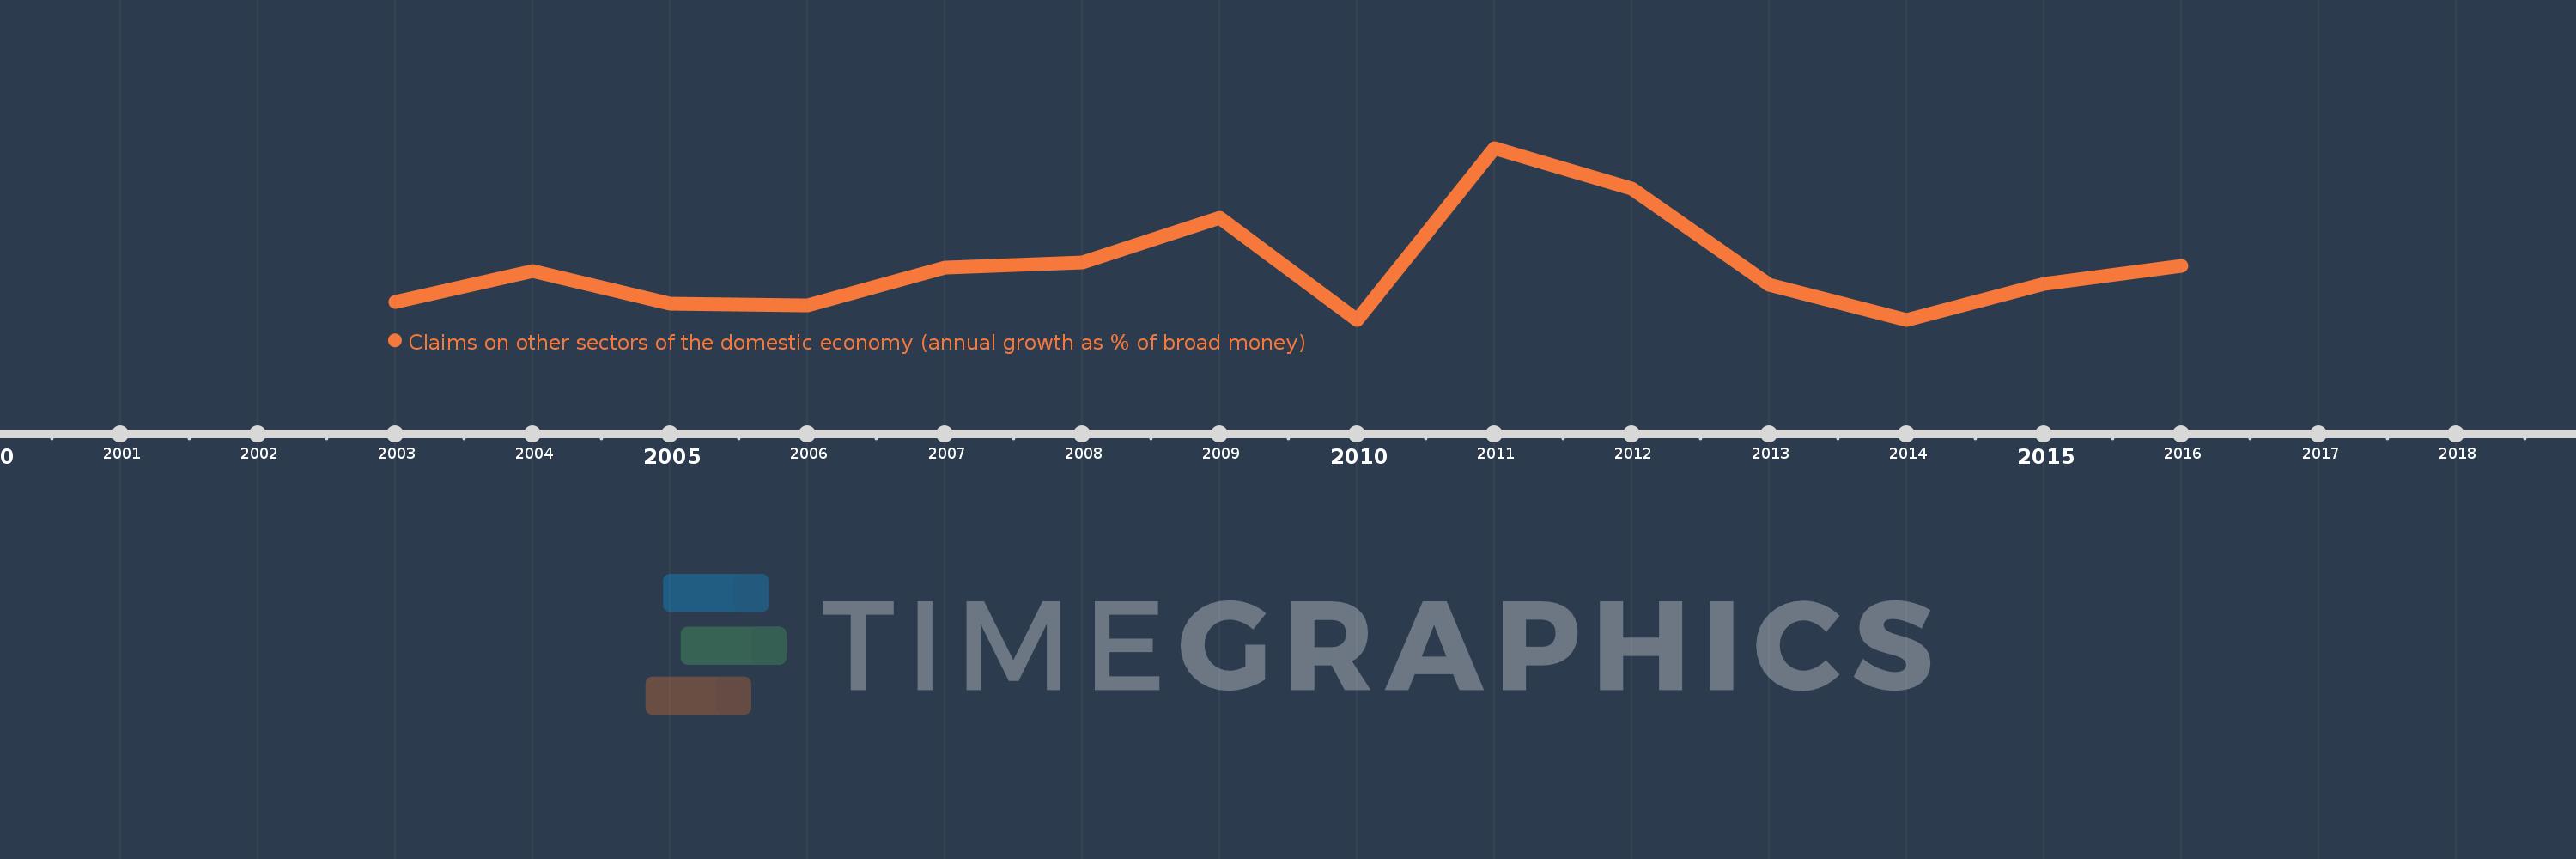
Questa scala temporale mostra un grafico dal 2003 anno al 2016 anno. Bhutan. I dati fino ad 2002 anno non disponibili. Il numero di osservazioni attuali secondo i date: 14.
La fonte (nome):
Indicatori dello sviluppo mondiale
La fonte (organizzazione):
International Monetary Fund, International Financial Statistics and data files.
Categorie:
Financial Sector
sono stati aggiornati
23 apr 2017 anni
Indicatori delle variazioni dei valori per anni
In media:
11.713
Minima:
6.324
1 gen 2010 anni
Massimo:
23.954
1 gen 2011 anni
Alla data di osservazione
Valore
Variazione assoluta
La variazione rispetto al valore precedente
1 gen 2003 anni
8.107
+8.107
0.0%
1 gen 2004 anni
11.308
+3.201
39.49%
1 gen 2005 anni
7.939
-3.369
-29.79%
1 gen 2006 anni
7.772
-0.167
-2.1%
1 gen 2007 anni
11.702
+3.93
50.56%
1 gen 2008 anni
12.214
+0.512
4.38%
1 gen 2009 anni
16.765
+4.551
37.26%
1 gen 2010 anni
6.324
-10.442
-62.28%
1 gen 2011 anni
23.954
+17.63
278.79%
1 gen 2012 anni
19.805
-4.148
-17.32%
1 gen 2013 anni
9.872
-9.933
-50.15%
1 gen 2014 anni
6.34
-3.532
-35.77%
1 gen 2015 anni
10.004
+3.663
57.78%
1 gen 2016 anni
11.877
+1.874
18.73%
Classificazione dei paesi secondo i statistiche attuali per anni