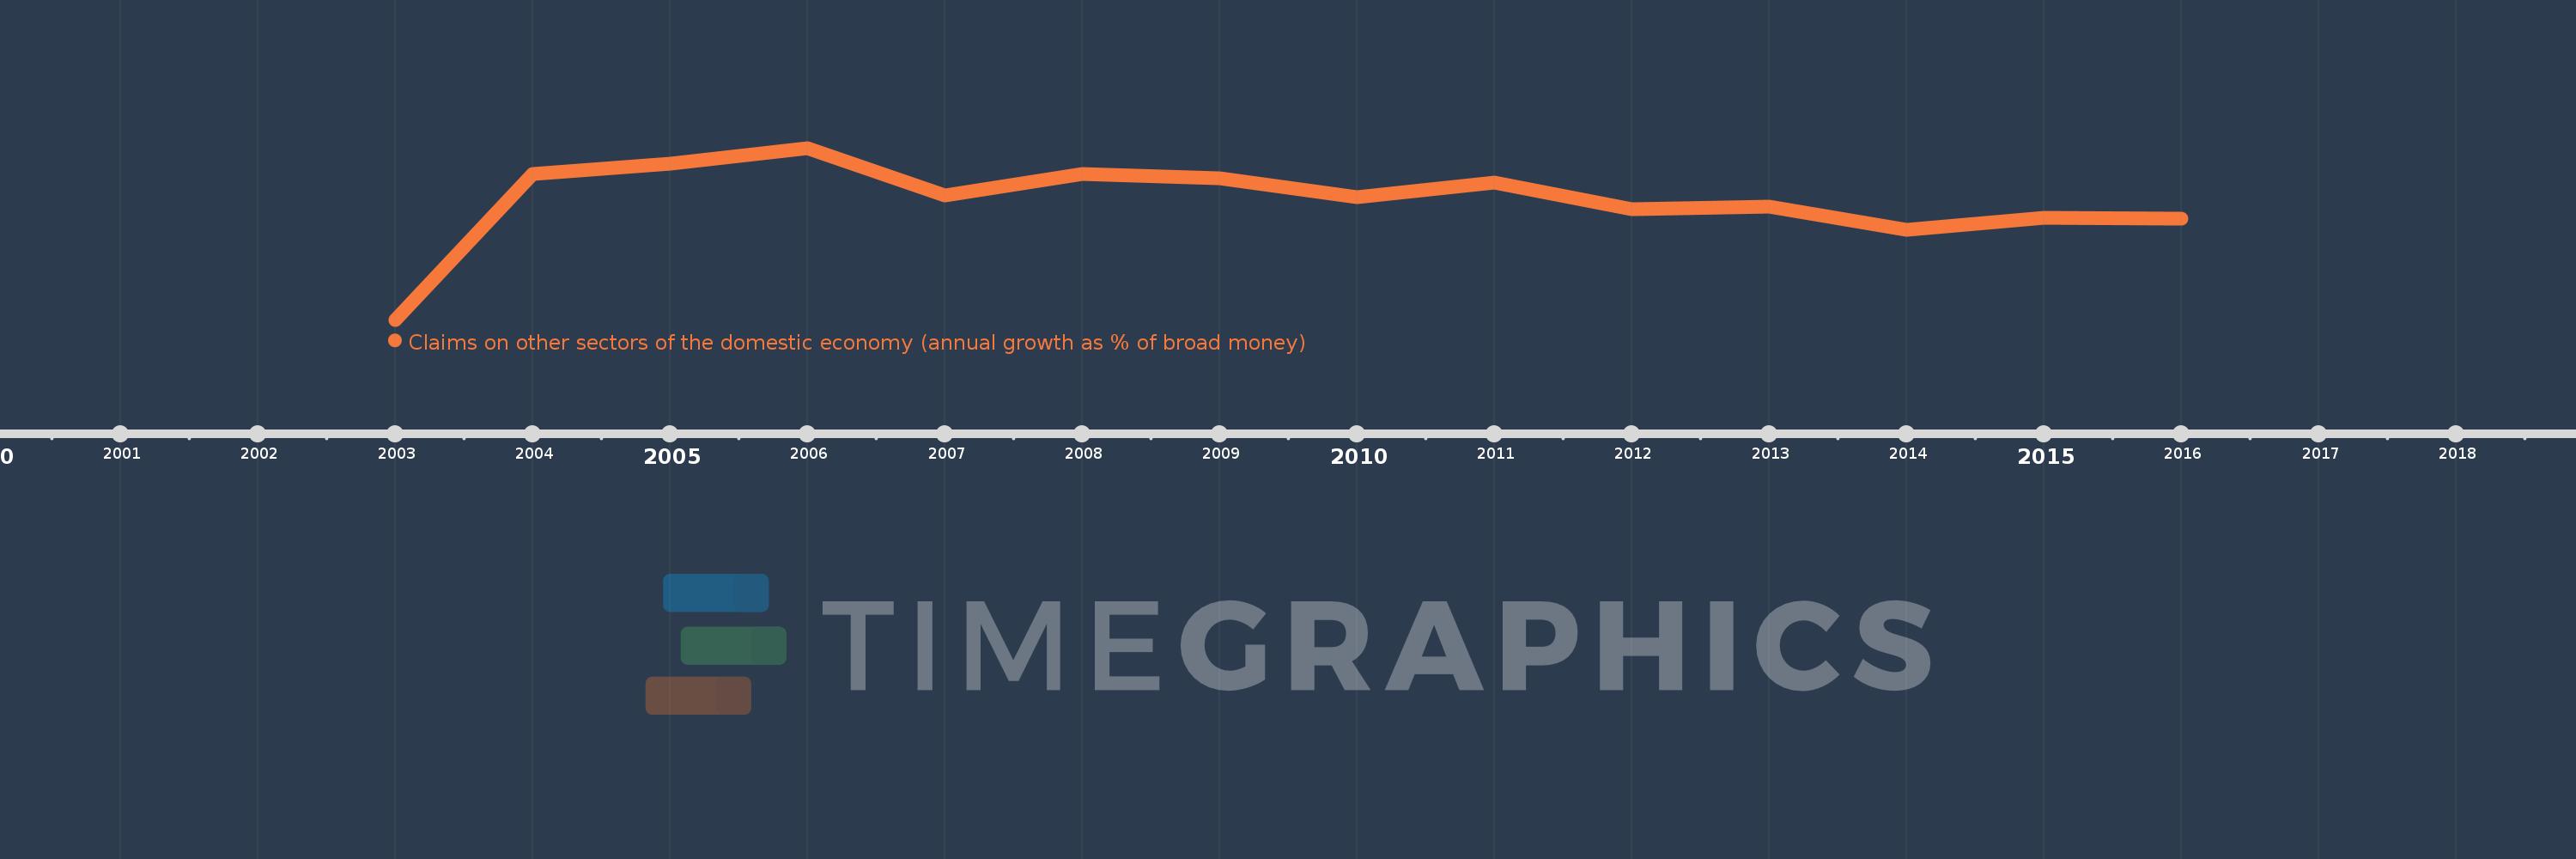
Questa scala temporale mostra un grafico dal 2003 anno al 2016 anno. Serbia. I dati fino ad 2002 anno non disponibili. Il numero di osservazioni attuali secondo i date: 14.
La fonte (nome):
Indicatori dello sviluppo mondiale
La fonte (organizzazione):
International Monetary Fund, International Financial Statistics and data files.
Categorie:
Financial Sector
sono stati aggiornati
23 apr 2017 anni
Indicatori delle variazioni dei valori per anni
In media:
15.591
Minima:
-71.04
1 gen 2003 anni
Massimo:
54.396
1 gen 2006 anni
Alla data di osservazione
Valore
Variazione assoluta
La variazione rispetto al valore precedente
1 gen 2003 anni
-71.04
-71.04
0.0%
1 gen 2004 anni
35.539
+106.579
-150.03%
1 gen 2005 anni
42.955
+7.416
20.87%
1 gen 2006 anni
54.396
+11.441
26.64%
1 gen 2007 anni
19.797
-34.599
-63.61%
1 gen 2008 anni
35.355
+15.558
78.59%
1 gen 2009 anni
32.122
-3.233
-9.14%
1 gen 2010 anni
18.266
-13.857
-43.14%
1 gen 2011 anni
29.1
+10.835
59.32%
1 gen 2012 anni
9.656
-19.444
-66.82%
1 gen 2013 anni
11.315
+1.659
17.18%
1 gen 2014 anni
-5.309
-16.625
-146.92%
1 gen 2015 anni
3.184
+8.493
-159.97%
1 gen 2016 anni
2.933
-0.252
-7.9%
Classificazione dei paesi secondo i statistiche attuali per anni