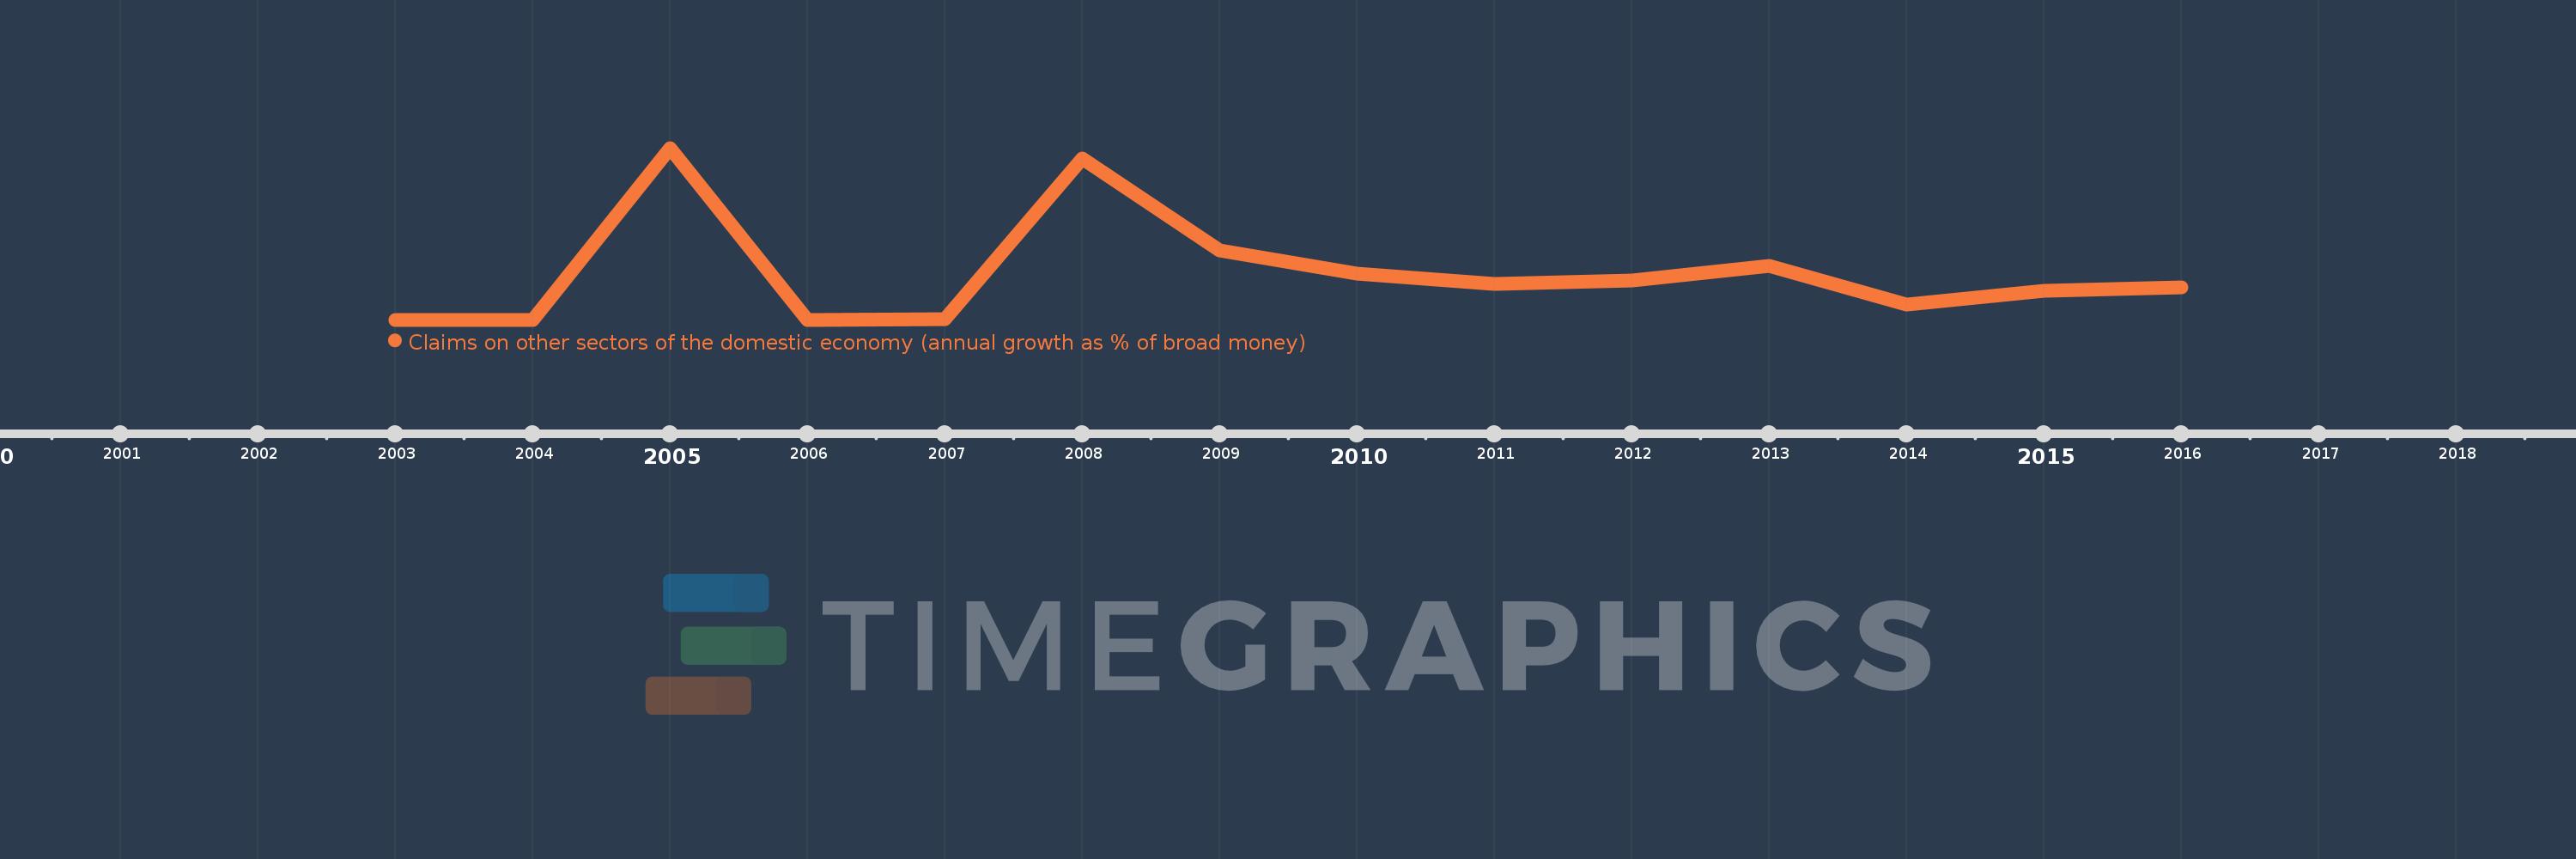
Questa scala temporale mostra un grafico dal 2003 anno al 2016 anno. Niger. I dati fino ad 2002 anno non disponibili. Il numero di osservazioni attuali secondo i date: 14.
La fonte (nome):
Indicatori dello sviluppo mondiale
La fonte (organizzazione):
International Monetary Fund, International Financial Statistics and data files.
Categorie:
Financial Sector
sono stati aggiornati
23 apr 2017 anni
Indicatori delle variazioni dei valori per anni
In media:
12.979
Minima:
0.0
1 gen 2003 anni
Massimo:
47.696
1 gen 2005 anni
Alla data di osservazione
Valore
Variazione assoluta
La variazione rispetto al valore precedente
1 gen 2003 anni
0.0
0.0
0.0%
1 gen 2004 anni
0.0
0.0
%
1 gen 2005 anni
47.696
+47.696
%
1 gen 2006 anni
0.008
-47.688
-99.98%
1 gen 2007 anni
0.053
+0.045
600.37%
1 gen 2008 anni
44.839
+44.787
85.25 Mille.%
1 gen 2009 anni
19.307
-25.532
-56.94%
1 gen 2010 anni
12.898
-6.409
-33.2%
1 gen 2011 anni
9.874
-3.024
-23.44%
1 gen 2012 anni
10.852
+0.978
9.9%
1 gen 2013 anni
14.999
+4.146
38.21%
1 gen 2014 anni
4.114
-10.885
-72.57%
1 gen 2015 anni
7.971
+3.857
93.77%
1 gen 2016 anni
9.102
+1.13
14.18%
Classificazione dei paesi secondo i statistiche attuali per anni