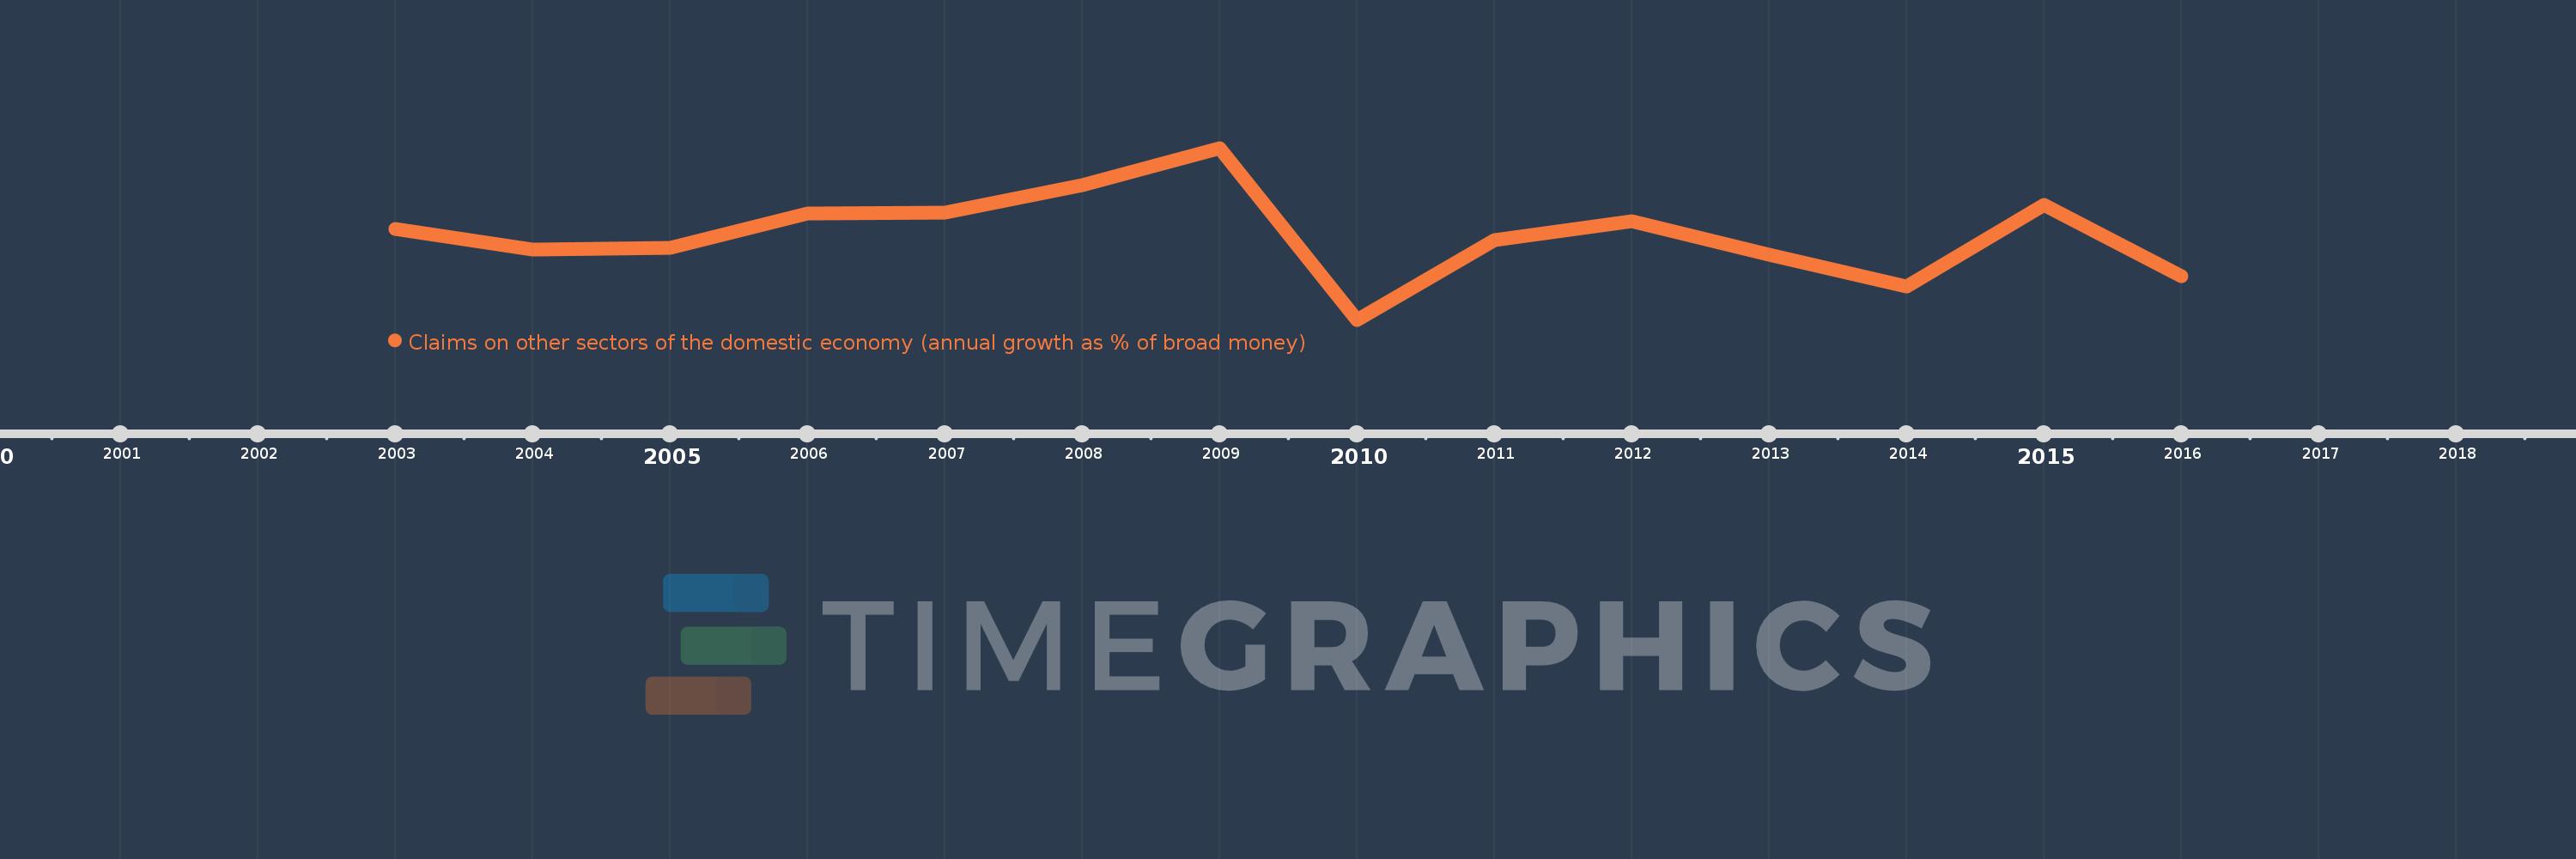
Questa scala temporale mostra un grafico dal 2003 anno al 2016 anno. Sweden. I dati fino ad 2002 anno non disponibili. Il numero di osservazioni attuali secondo i date: 14.
La fonte (nome):
Indicatori dello sviluppo mondiale
La fonte (organizzazione):
International Monetary Fund, International Financial Statistics and data files.
Categorie:
Financial Sector
sono stati aggiornati
23 apr 2017 anni
Indicatori delle variazioni dei valori per anni
In media:
15.241
Minima:
-11.563
1 gen 2010 anni
Massimo:
42.796
1 gen 2009 anni
Alla data di osservazione
Valore
Variazione assoluta
La variazione rispetto al valore precedente
1 gen 2003 anni
17.274
+17.274
0.0%
1 gen 2004 anni
10.68
-6.594
-38.17%
1 gen 2005 anni
11.225
+0.545
5.1%
1 gen 2006 anni
21.998
+10.773
95.97%
1 gen 2007 anni
22.201
+0.203
0.92%
1 gen 2008 anni
31.015
+8.813
39.7%
1 gen 2009 anni
42.796
+11.781
37.99%
1 gen 2010 anni
-11.563
-54.359
-127.02%
1 gen 2011 anni
13.517
+25.08
-216.9%
1 gen 2012 anni
19.628
+6.11
45.2%
1 gen 2013 anni
8.889
-10.739
-54.71%
1 gen 2014 anni
-1.095
-9.983
-112.31%
1 gen 2015 anni
24.643
+25.738
-2.35 Mille.%
1 gen 2016 anni
2.167
-22.476
-91.21%
Classificazione dei paesi secondo i statistiche attuali per anni