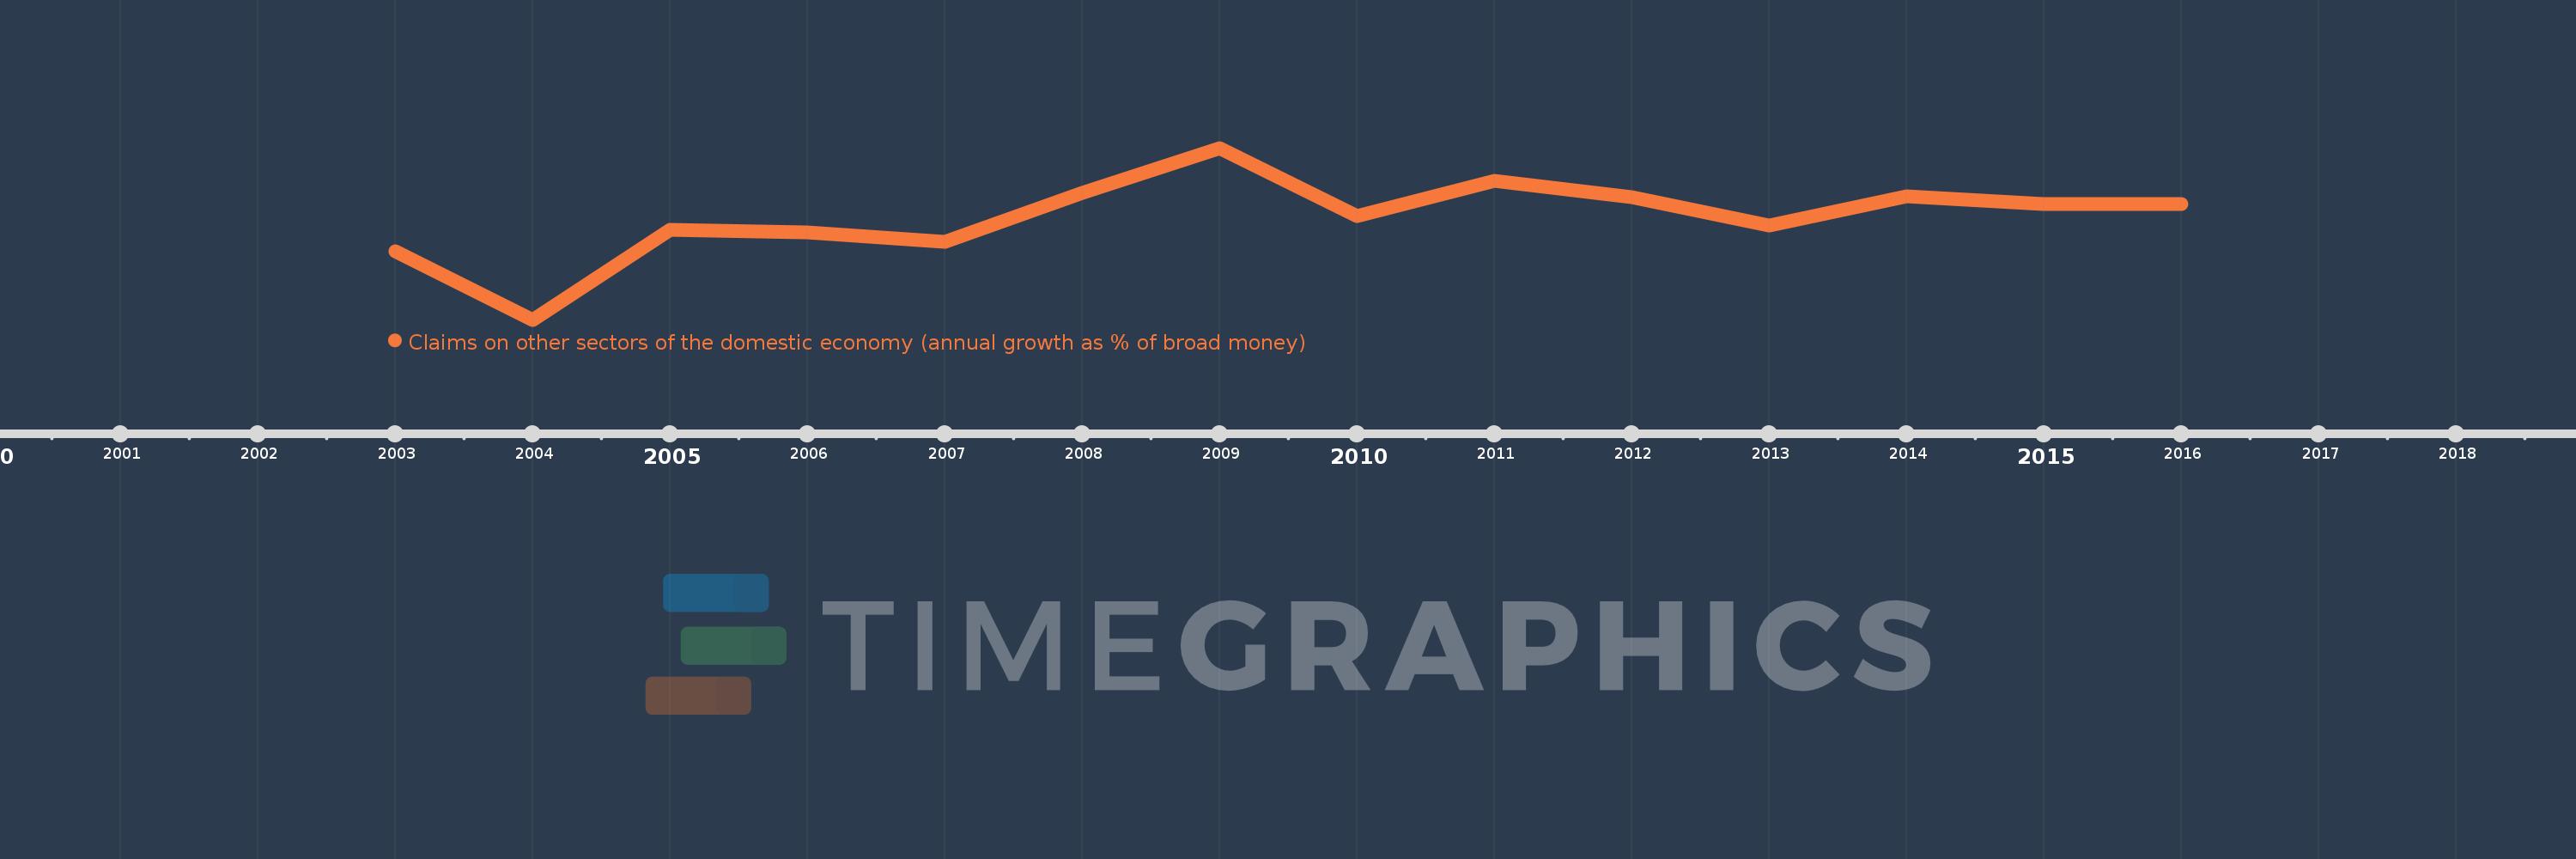
Questa scala temporale mostra un grafico dal 2003 anno al 2016 anno. Paraguay. I dati fino ad 2002 anno non disponibili. Il numero di osservazioni attuali secondo i date: 14.
La fonte (nome):
Indicatori dello sviluppo mondiale
La fonte (organizzazione):
International Monetary Fund, International Financial Statistics and data files.
Categorie:
Financial Sector
sono stati aggiornati
23 apr 2017 anni
Indicatori delle variazioni dei valori per anni
In media:
14.077
Minima:
-23.485
1 gen 2004 anni
Massimo:
39.392
1 gen 2009 anni
Alla data di osservazione
Valore
Variazione assoluta
La variazione rispetto al valore precedente
1 gen 2003 anni
1.692
+1.692
0.0%
1 gen 2004 anni
-23.485
-25.177
-1.49 Mille.%
1 gen 2005 anni
9.497
+32.983
-140.44%
1 gen 2006 anni
8.592
-0.906
-9.53%
1 gen 2007 anni
4.989
-3.603
-41.94%
1 gen 2008 anni
23.053
+18.065
362.12%
1 gen 2009 anni
39.392
+16.339
70.87%
1 gen 2010 anni
14.368
-25.024
-63.52%
1 gen 2011 anni
27.21
+12.842
89.37%
1 gen 2012 anni
21.433
-5.777
-21.23%
1 gen 2013 anni
11.15
-10.283
-47.98%
1 gen 2014 anni
21.648
+10.498
94.16%
1 gen 2015 anni
18.772
-2.876
-13.29%
1 gen 2016 anni
18.773
+0.001
0.0%
Classificazione dei paesi secondo i statistiche attuali per anni