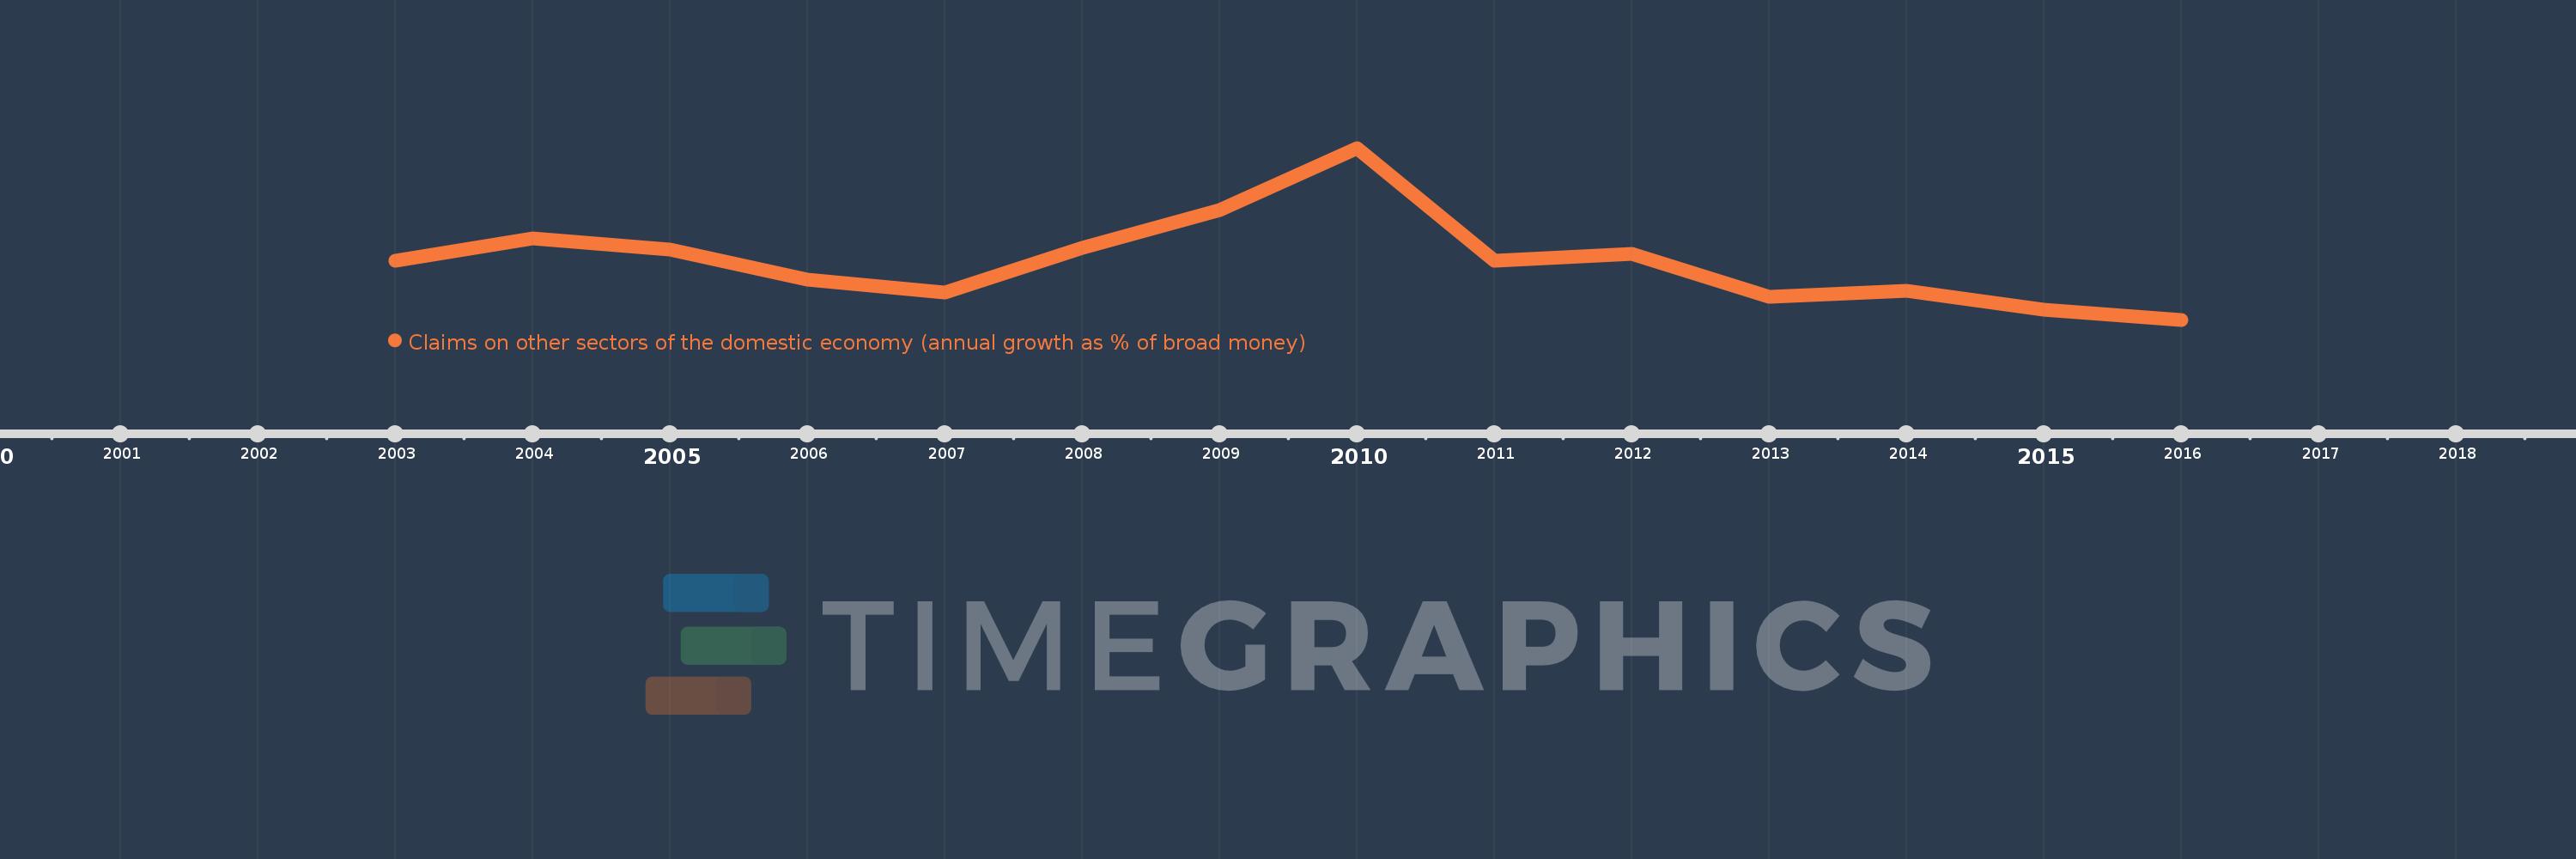
Questa scala temporale mostra un grafico dal 2003 anno al 2016 anno. Sierra Leone. I dati fino ad 2002 anno non disponibili. Il numero di osservazioni attuali secondo i date: 14.
La fonte (nome):
Indicatori dello sviluppo mondiale
La fonte (organizzazione):
International Monetary Fund, International Financial Statistics and data files.
Categorie:
Financial Sector
sono stati aggiornati
23 apr 2017 anni
Indicatori delle variazioni dei valori per anni
In media:
8.089
Minima:
0.29
1 gen 2016 anni
Massimo:
23.213
1 gen 2010 anni
Alla data di osservazione
Valore
Variazione assoluta
La variazione rispetto al valore precedente
1 gen 2003 anni
8.21
+8.21
0.0%
1 gen 2004 anni
11.105
+2.895
35.26%
1 gen 2005 anni
9.703
-1.402
-12.62%
1 gen 2006 anni
5.648
-4.055
-41.8%
1 gen 2007 anni
3.912
-1.736
-30.73%
1 gen 2008 anni
9.898
+5.986
153.01%
1 gen 2009 anni
14.947
+5.05
51.02%
1 gen 2010 anni
23.213
+8.266
55.3%
1 gen 2011 anni
8.152
-15.062
-64.88%
1 gen 2012 anni
9.069
+0.917
11.25%
1 gen 2013 anni
3.298
-5.771
-63.64%
1 gen 2014 anni
4.195
+0.897
27.21%
1 gen 2015 anni
1.608
-2.587
-61.67%
1 gen 2016 anni
0.29
-1.318
-81.96%
Classificazione dei paesi secondo i statistiche attuali per anni