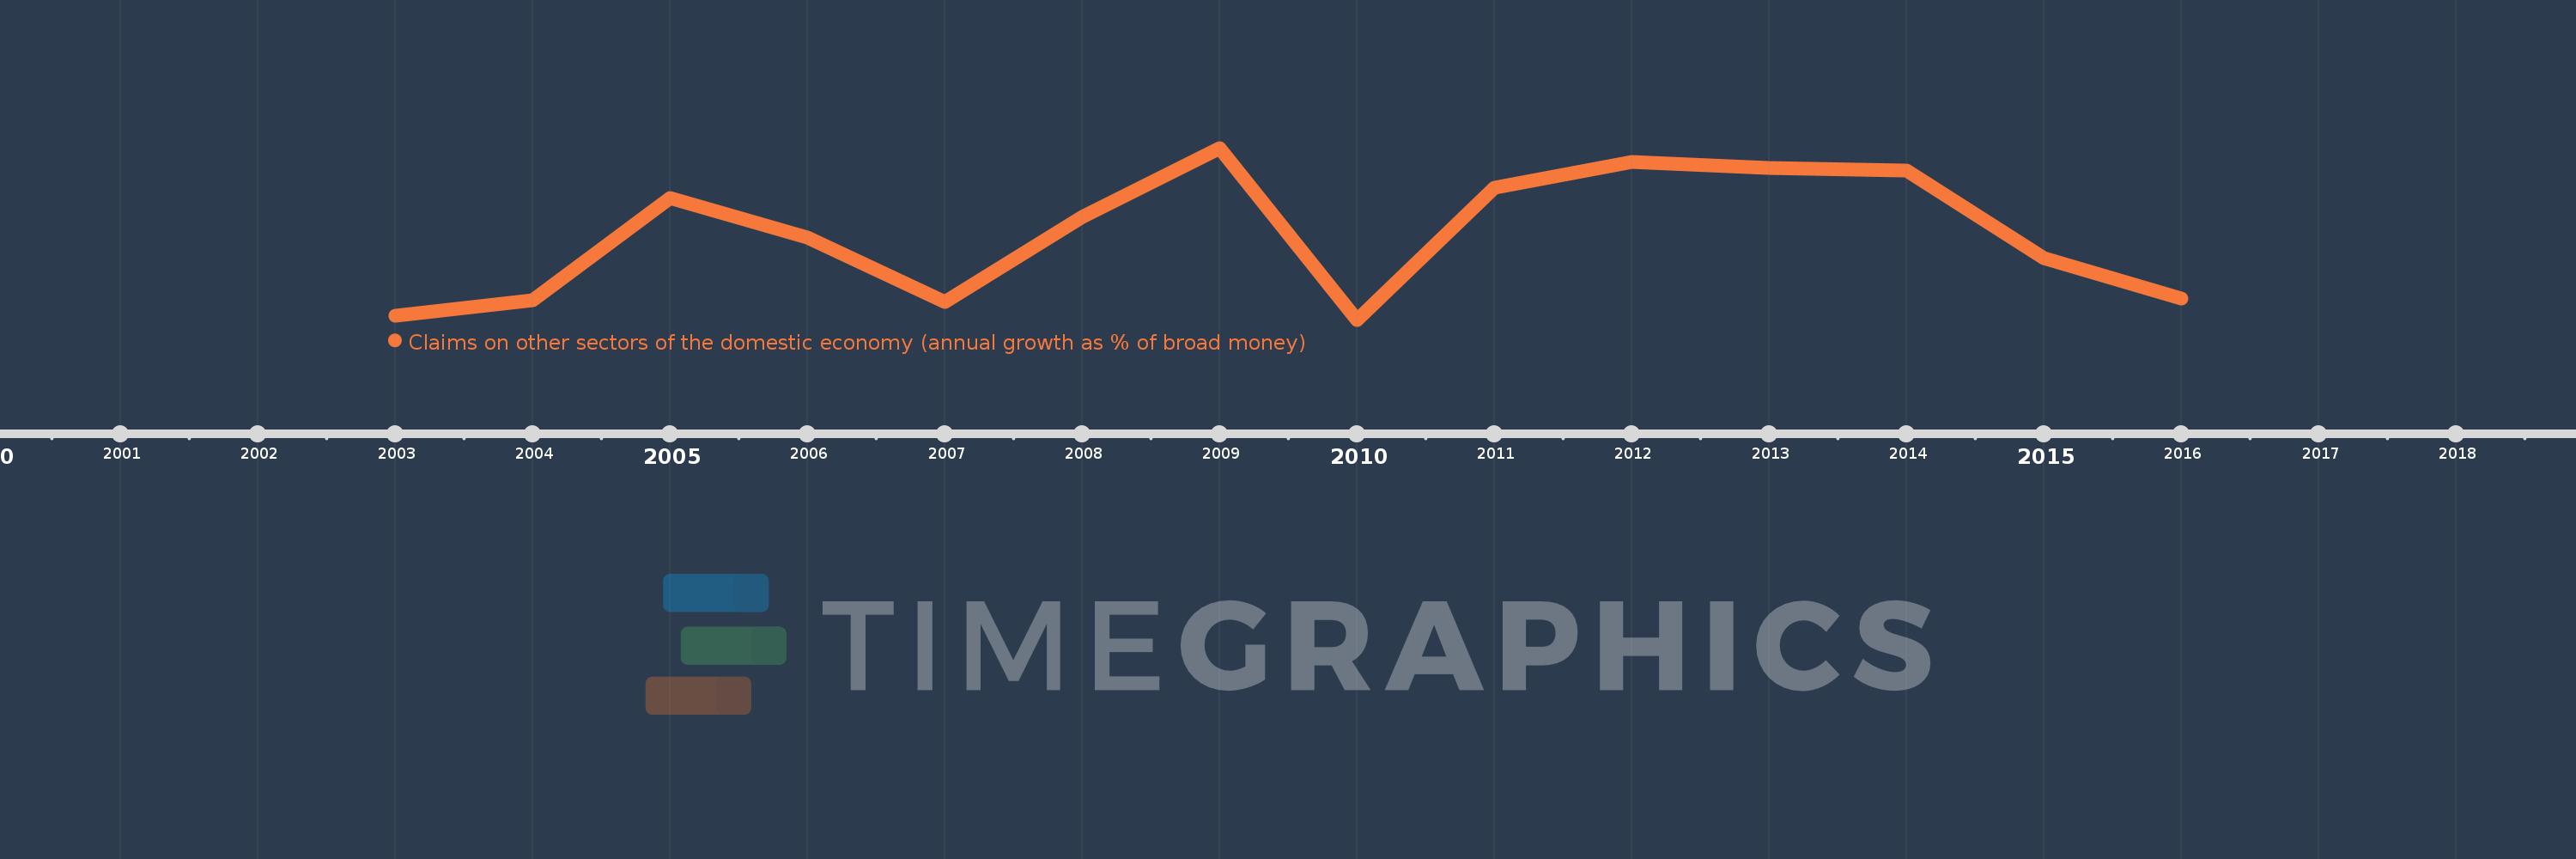
Questa scala temporale mostra un grafico dal 2003 anno al 2016 anno. Indonesia. I dati fino ad 2002 anno non disponibili. Il numero di osservazioni attuali secondo i date: 14.
La fonte (nome):
Indicatori dello sviluppo mondiale
La fonte (organizzazione):
International Monetary Fund, International Financial Statistics and data files.
Categorie:
Financial Sector
sono stati aggiornati
23 apr 2017 anni
Indicatori delle variazioni dei valori per anni
In media:
13.483
Minima:
6.894
1 gen 2010 anni
Massimo:
20.158
1 gen 2009 anni
Alla data di osservazione
Valore
Variazione assoluta
La variazione rispetto al valore precedente
1 gen 2003 anni
7.23
+7.23
0.0%
1 gen 2004 anni
8.422
+1.192
16.48%
1 gen 2005 anni
16.265
+7.843
93.14%
1 gen 2006 anni
13.223
-3.042
-18.71%
1 gen 2007 anni
8.296
-4.927
-37.26%
1 gen 2008 anni
14.848
+6.552
78.98%
1 gen 2009 anni
20.158
+5.31
35.76%
1 gen 2010 anni
6.894
-13.264
-65.8%
1 gen 2011 anni
17.095
+10.201
147.96%
1 gen 2012 anni
19.105
+2.01
11.76%
1 gen 2013 anni
18.605
-0.5
-2.62%
1 gen 2014 anni
18.415
-0.19
-1.02%
1 gen 2015 anni
11.663
-6.752
-36.67%
1 gen 2016 anni
8.543
-3.12
-26.75%
Classificazione dei paesi secondo i statistiche attuali per anni