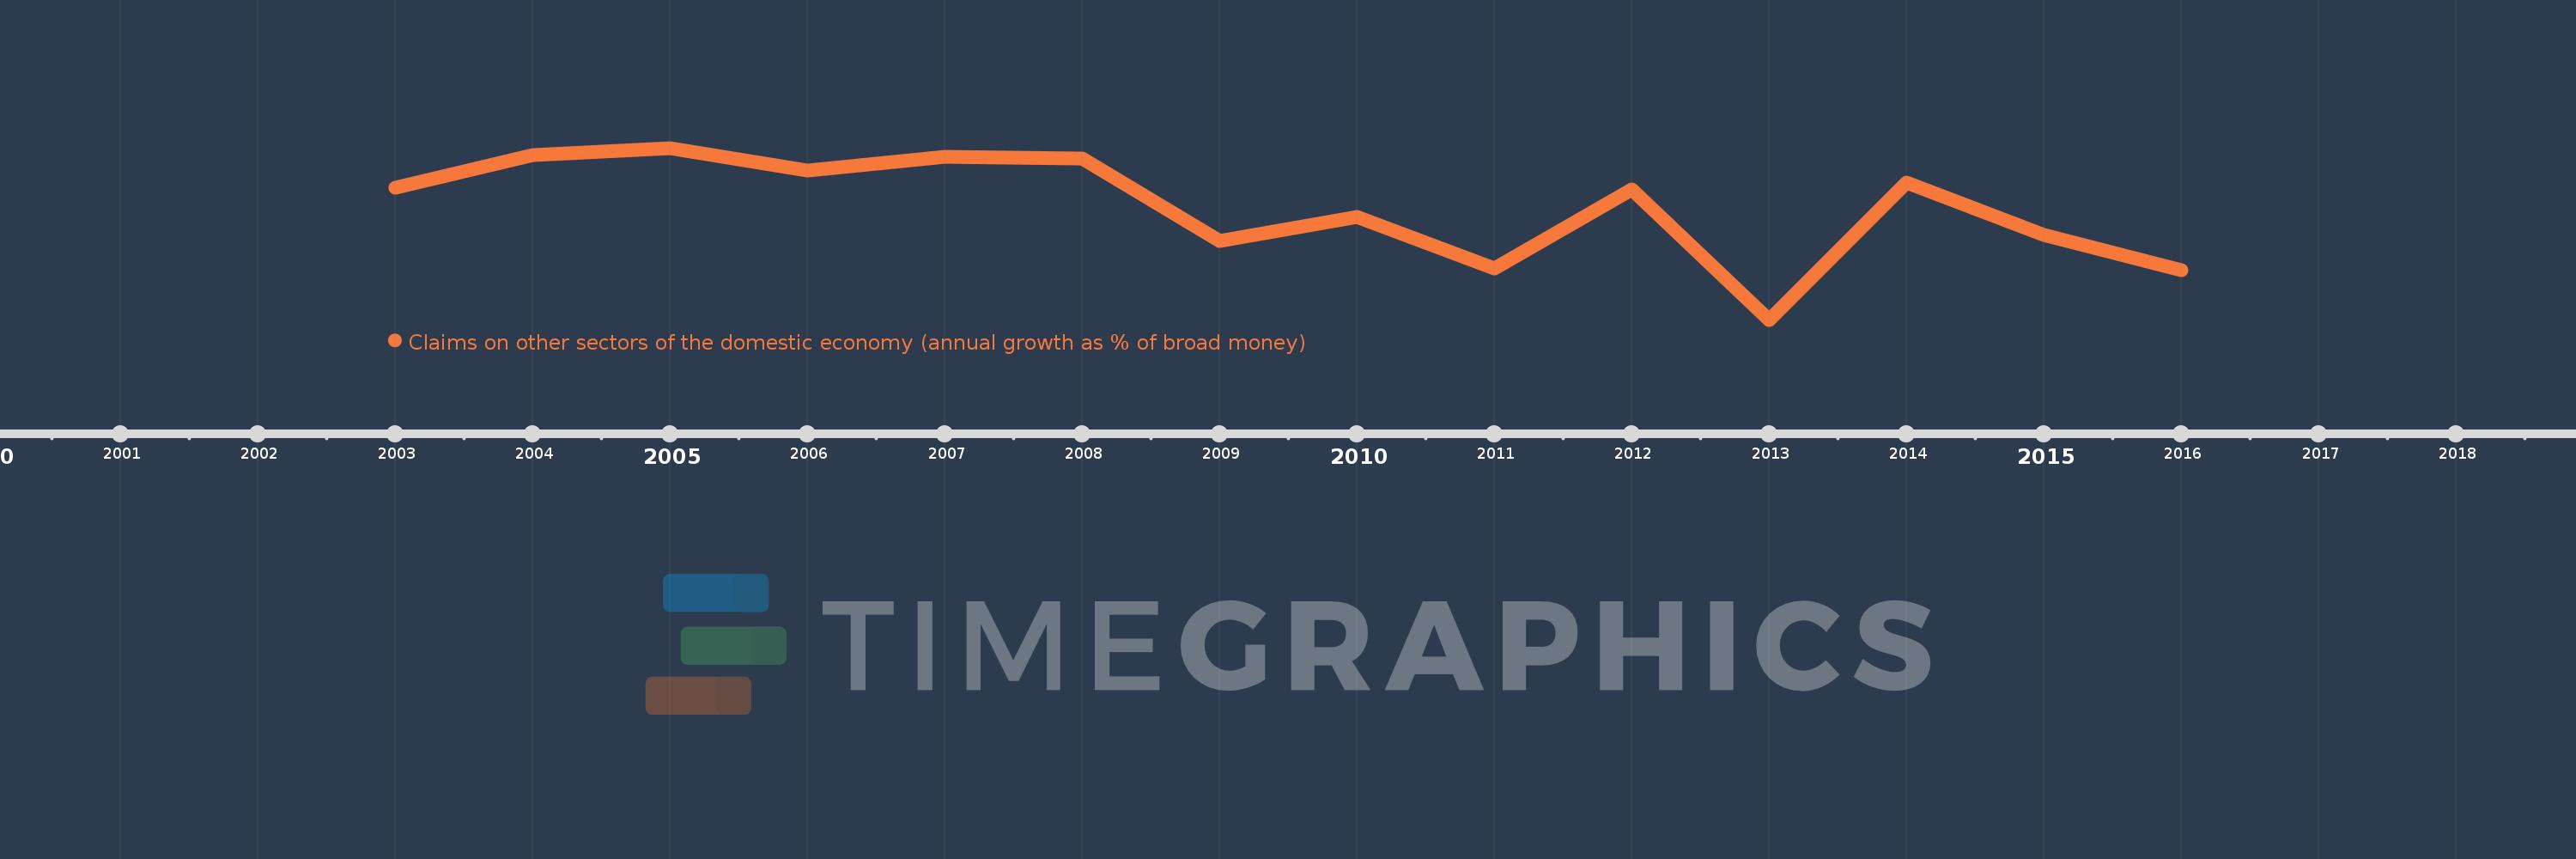
Questa scala temporale mostra un grafico dal 2003 anno al 2016 anno. Swaziland. I dati fino ad 2002 anno non disponibili. Il numero di osservazioni attuali secondo i date: 14.
La fonte (nome):
Indicatori dello sviluppo mondiale
La fonte (organizzazione):
International Monetary Fund, International Financial Statistics and data files.
Categorie:
Financial Sector
sono stati aggiornati
23 apr 2017 anni
Indicatori delle variazioni dei valori per anni
In media:
13.977
Minima:
-2.472
1 gen 2013 anni
Massimo:
22.627
1 gen 2005 anni
Alla data di osservazione
Valore
Variazione assoluta
La variazione rispetto al valore precedente
1 gen 2003 anni
16.85
+16.85
0.0%
1 gen 2004 anni
21.542
+4.692
27.85%
1 gen 2005 anni
22.627
+1.085
5.04%
1 gen 2006 anni
19.328
-3.299
-14.58%
1 gen 2007 anni
21.275
+1.946
10.07%
1 gen 2008 anni
21.12
-0.155
-0.73%
1 gen 2009 anni
9.023
-12.097
-57.28%
1 gen 2010 anni
12.512
+3.488
38.66%
1 gen 2011 anni
5.031
-7.48
-59.79%
1 gen 2012 anni
16.582
+11.55
229.57%
1 gen 2013 anni
-2.472
-19.054
-114.91%
1 gen 2014 anni
17.572
+20.044
-810.73%
1 gen 2015 anni
9.939
-7.633
-43.44%
1 gen 2016 anni
4.756
-5.183
-52.15%
Classificazione dei paesi secondo i statistiche attuali per anni