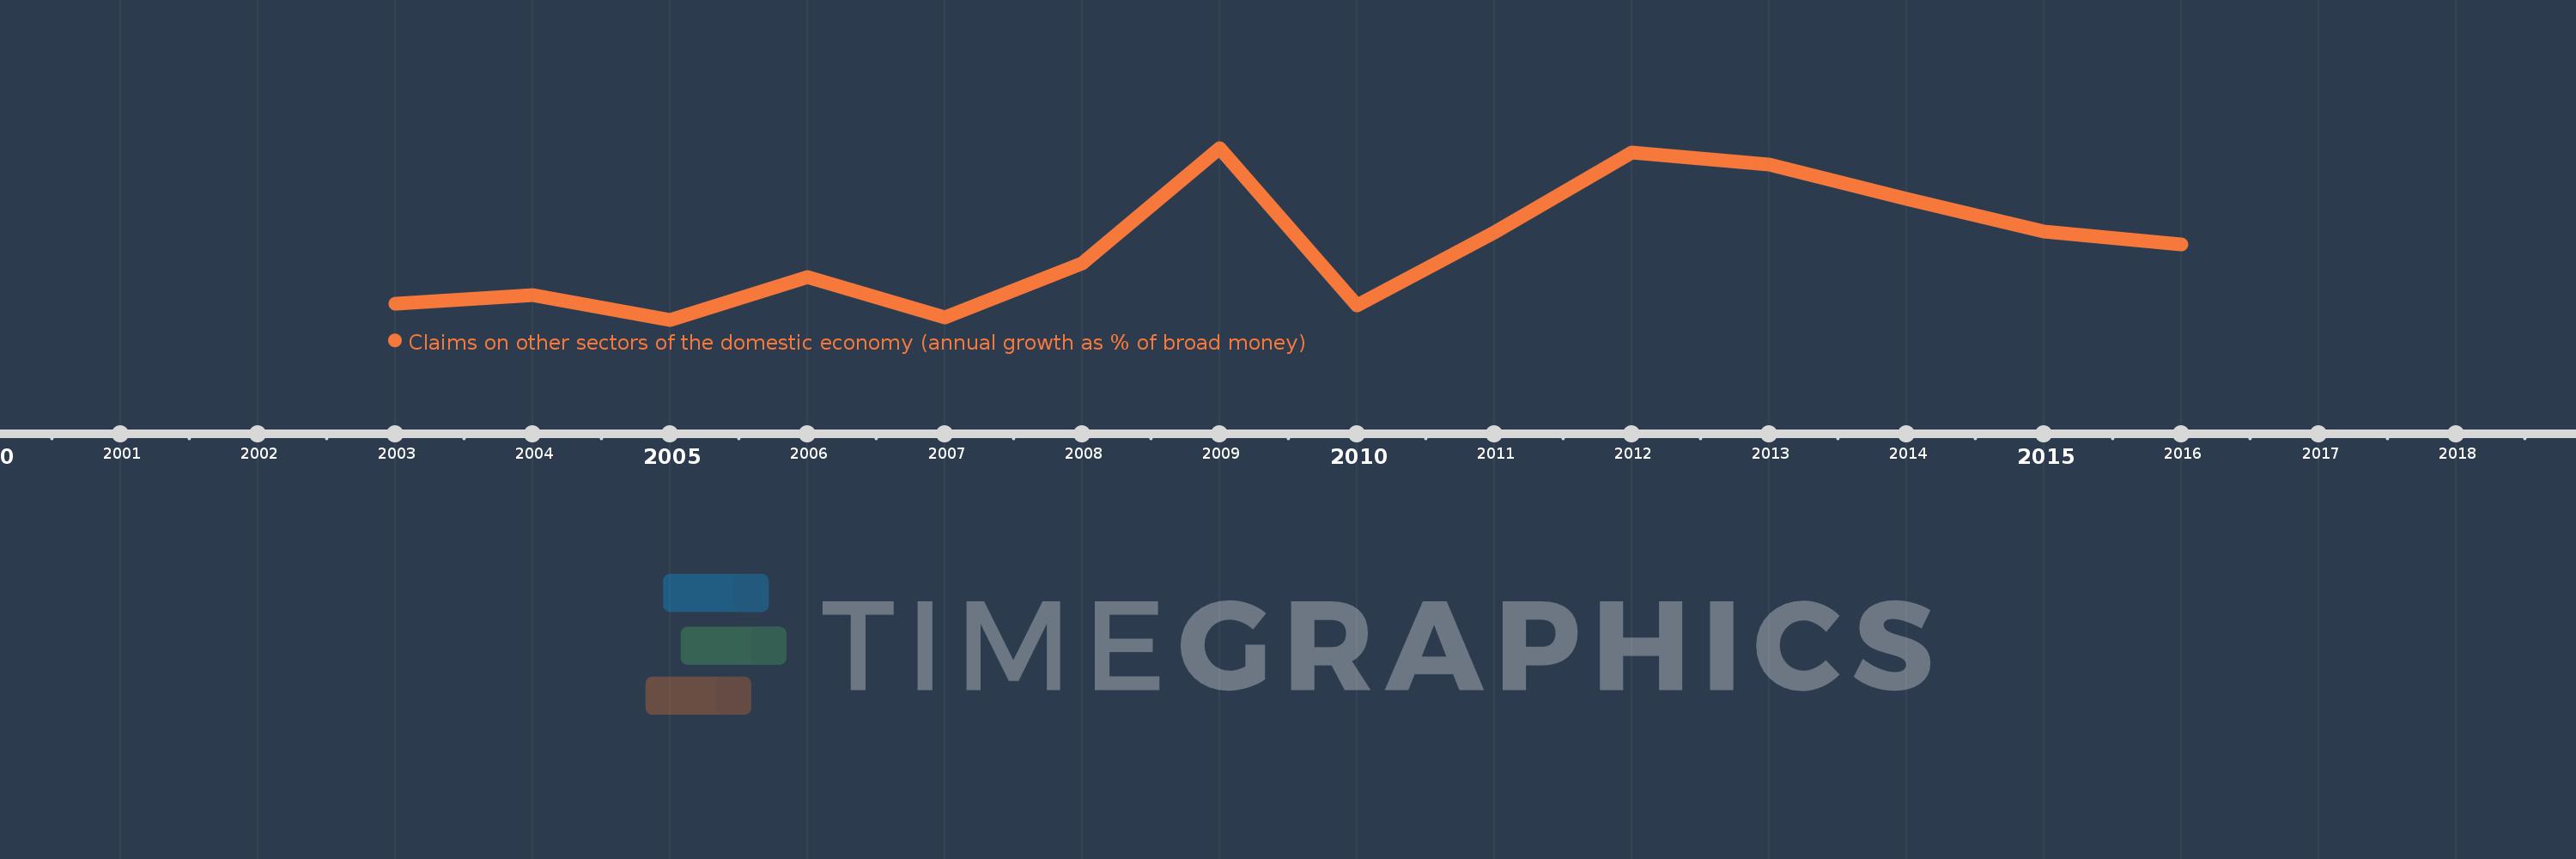
Questa scala temporale mostra un grafico dal 2003 anno al 2016 anno. Malaysia. I dati fino ad 2002 anno non disponibili. Il numero di osservazioni attuali secondo i date: 14.
La fonte (nome):
Indicatori dello sviluppo mondiale
La fonte (organizzazione):
International Monetary Fund, International Financial Statistics and data files.
Categorie:
Financial Sector
sono stati aggiornati
23 apr 2017 anni
Indicatori delle variazioni dei valori per anni
In media:
7.63
Minima:
4.987
1 gen 2005 anni
Massimo:
11.208
1 gen 2009 anni
Alla data di osservazione
Valore
Variazione assoluta
La variazione rispetto al valore precedente
1 gen 2003 anni
5.582
+5.582
0.0%
1 gen 2004 anni
5.867
+0.285
5.11%
1 gen 2005 anni
4.987
-0.88
-14.99%
1 gen 2006 anni
6.548
+1.561
31.3%
1 gen 2007 anni
5.074
-1.474
-22.51%
1 gen 2008 anni
7.03
+1.956
38.54%
1 gen 2009 anni
11.208
+4.178
59.42%
1 gen 2010 anni
5.493
-5.716
-50.99%
1 gen 2011 anni
8.137
+2.644
48.15%
1 gen 2012 anni
11.036
+2.899
35.62%
1 gen 2013 anni
10.616
-0.42
-3.8%
1 gen 2014 anni
9.36
-1.256
-11.83%
1 gen 2015 anni
8.176
-1.184
-12.65%
1 gen 2016 anni
7.701
-0.475
-5.81%
Classificazione dei paesi secondo i statistiche attuali per anni