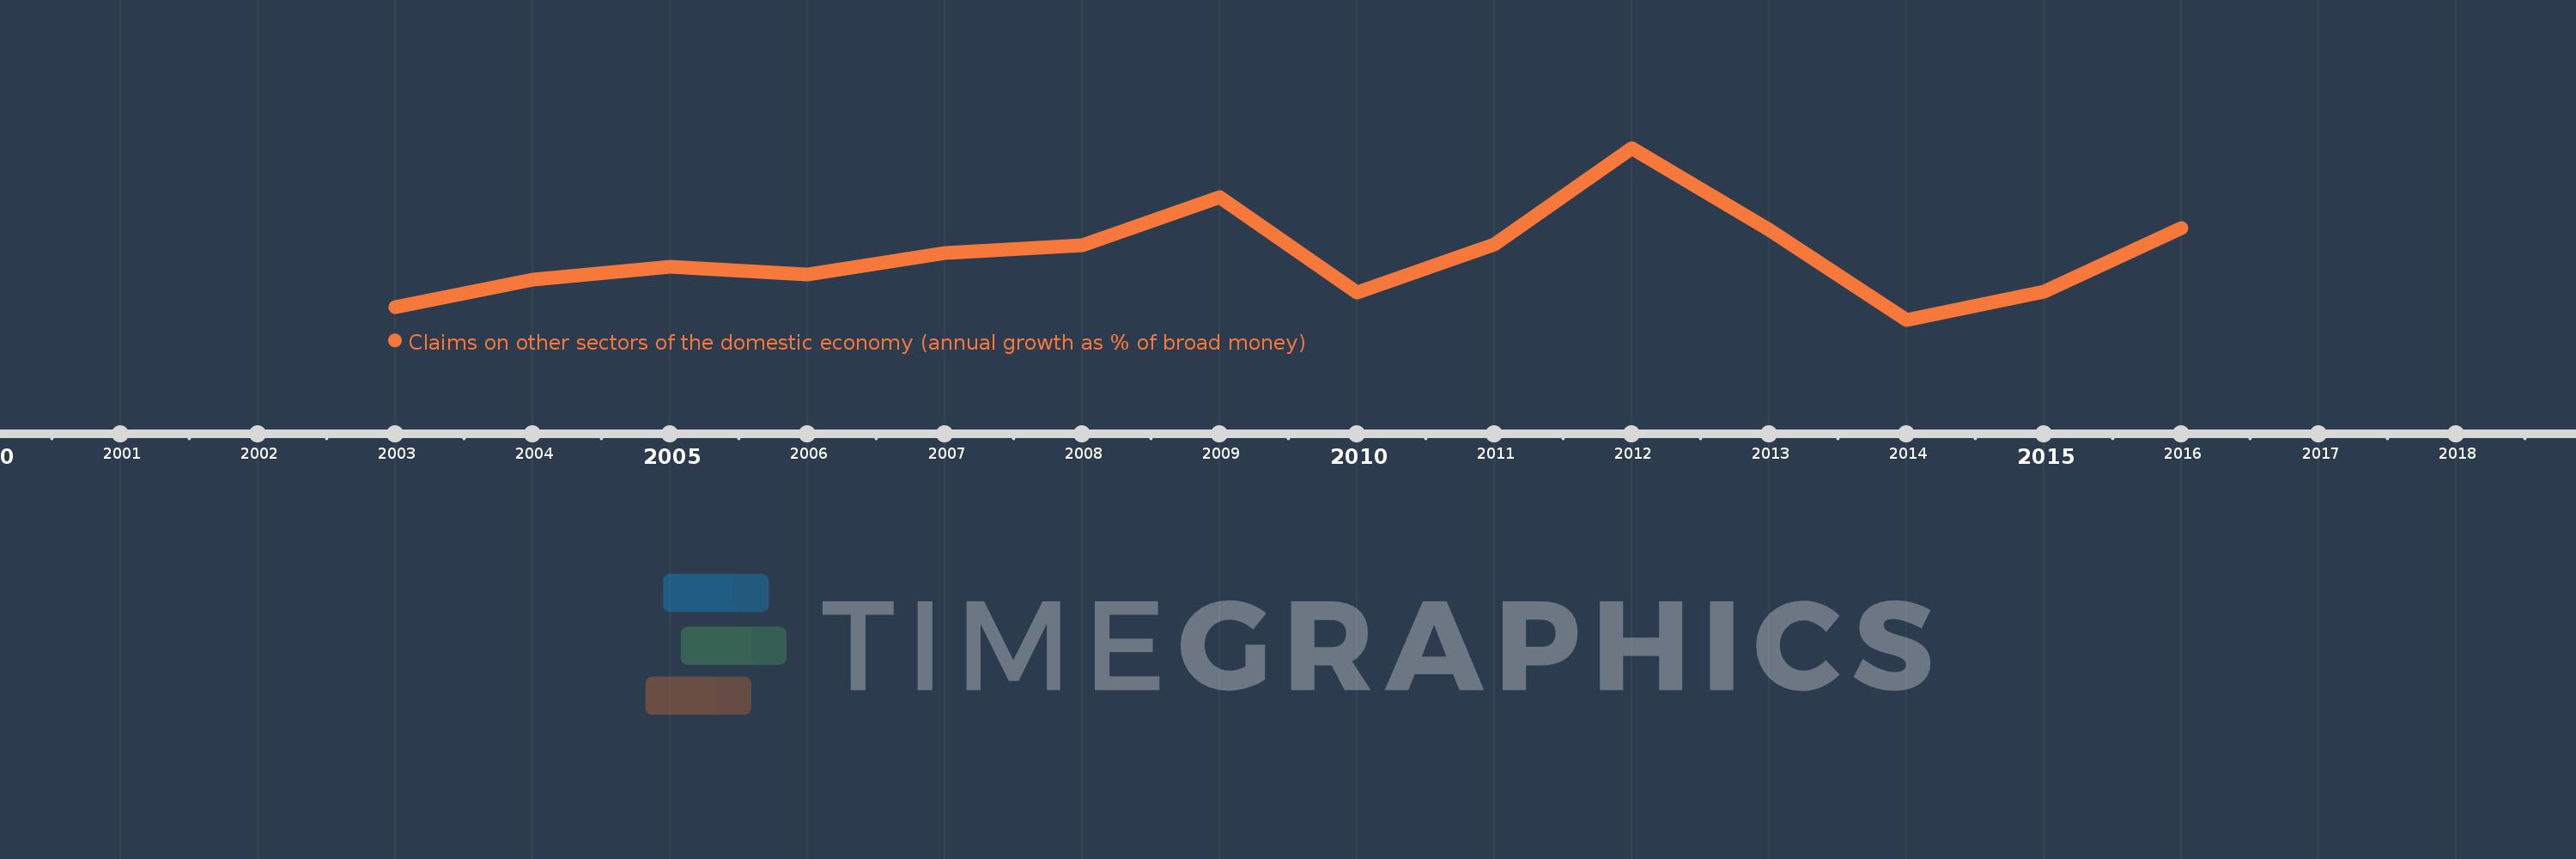
Questa scala temporale mostra un grafico dal 2003 anno al 2016 anno. Guinea-Bissau. I dati fino ad 2002 anno non disponibili. Il numero di osservazioni attuali secondo i date: 14.
La fonte (nome):
Indicatori dello sviluppo mondiale
La fonte (organizzazione):
International Monetary Fund, International Financial Statistics and data files.
Categorie:
Financial Sector
sono stati aggiornati
23 apr 2017 anni
Indicatori delle variazioni dei valori per anni
In media:
6.006
Minima:
-4.039
1 gen 2014 anni
Massimo:
22.894
1 gen 2012 anni
Alla data di osservazione
Valore
Variazione assoluta
La variazione rispetto al valore precedente
1 gen 2003 anni
-2.114
-2.114
0.0%
1 gen 2004 anni
2.197
+4.311
-203.93%
1 gen 2005 anni
4.316
+2.119
96.46%
1 gen 2006 anni
2.999
-1.317
-30.52%
1 gen 2007 anni
6.382
+3.383
112.8%
1 gen 2008 anni
7.625
+1.242
19.46%
1 gen 2009 anni
15.199
+7.575
99.35%
1 gen 2010 anni
0.238
-14.961
-98.43%
1 gen 2011 anni
7.738
+7.5
3.15 Mille.%
1 gen 2012 anni
22.894
+15.156
195.86%
1 gen 2013 anni
10.039
-12.855
-56.15%
1 gen 2014 anni
-4.039
-14.078
-140.24%
1 gen 2015 anni
0.329
+4.369
-108.15%
1 gen 2016 anni
10.275
+9.946
3.02 Mille.%
Classificazione dei paesi secondo i statistiche attuali per anni