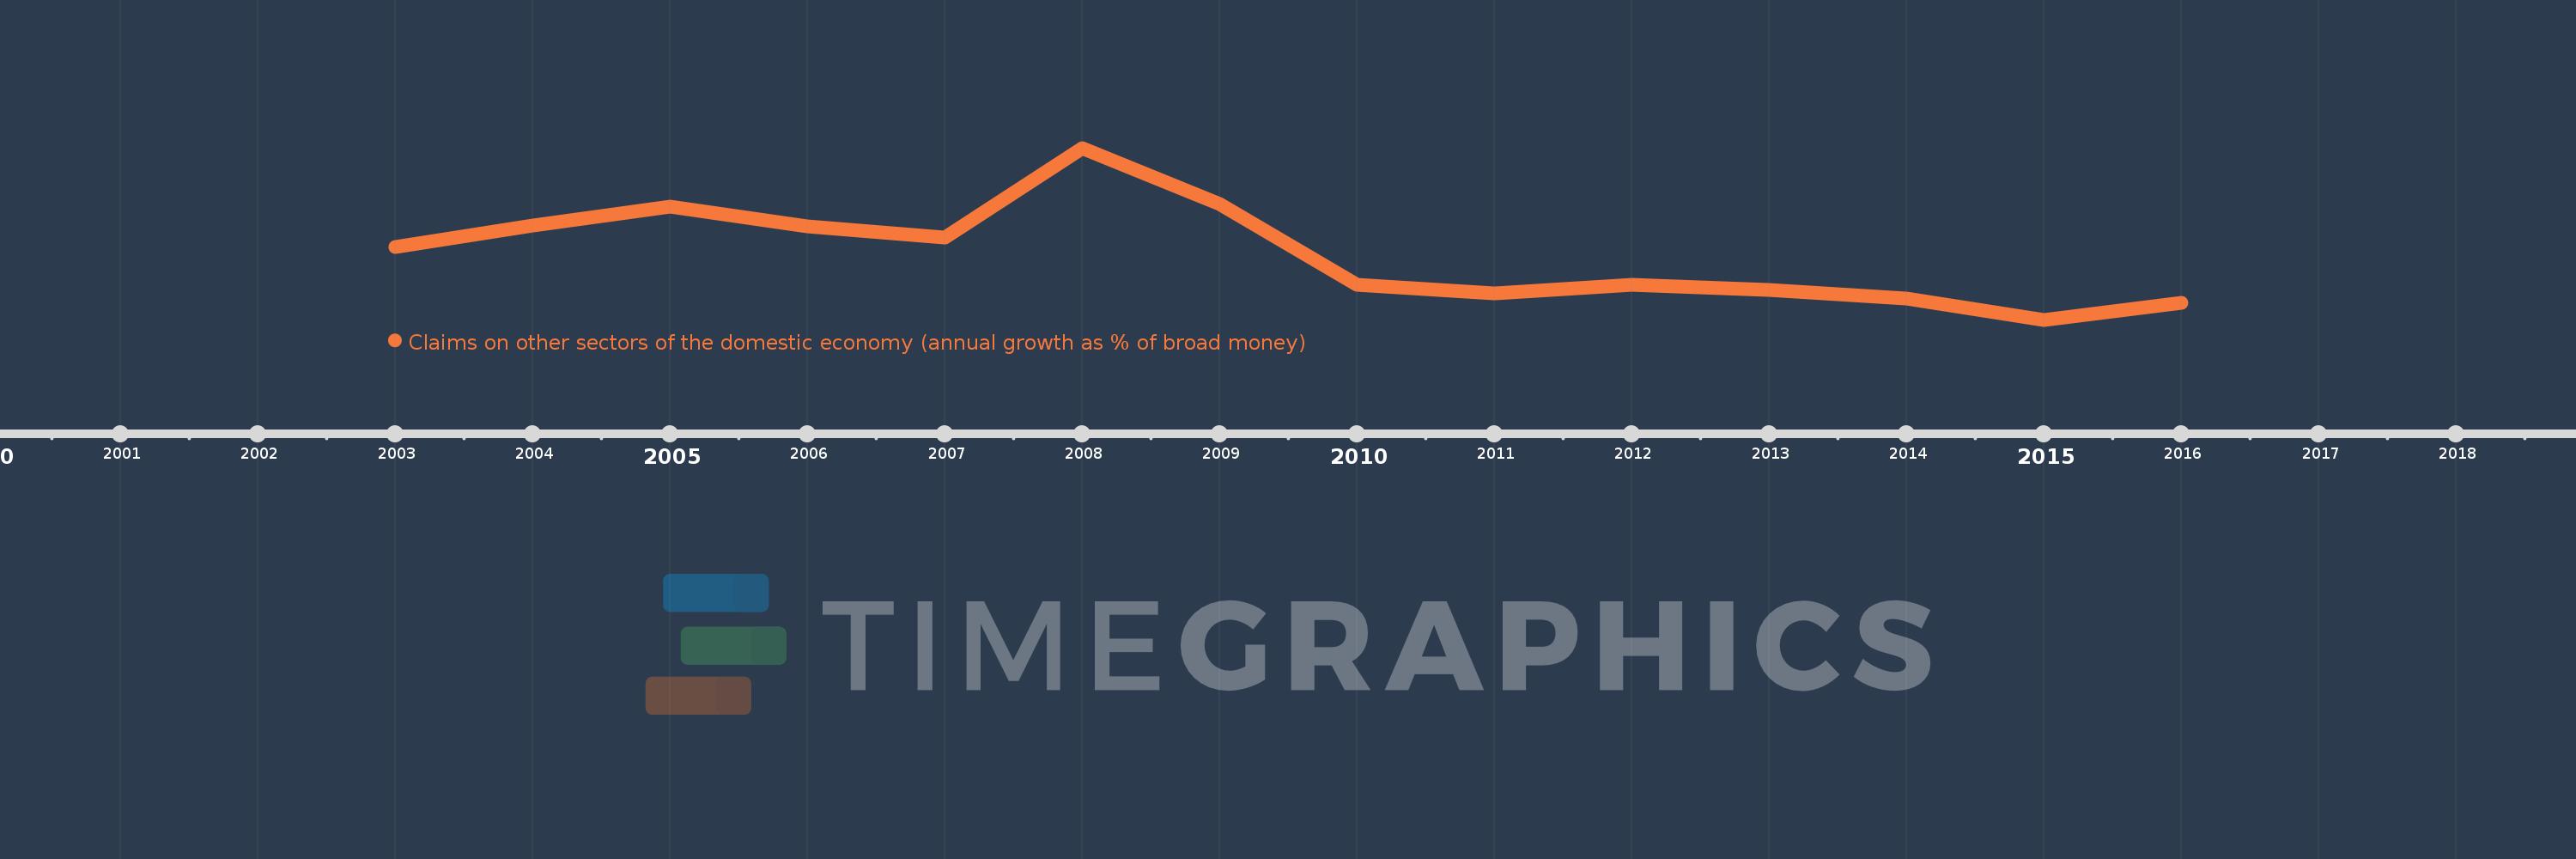
Questa scala temporale mostra un grafico dal 2003 anno al 2016 anno. Bulgaria. I dati fino ad 2002 anno non disponibili. Il numero di osservazioni attuali secondo i date: 14.
La fonte (nome):
Indicatori dello sviluppo mondiale
La fonte (organizzazione):
International Monetary Fund, International Financial Statistics and data files.
Categorie:
Financial Sector
sono stati aggiornati
23 apr 2017 anni
Indicatori delle variazioni dei valori per anni
In media:
13.228
Minima:
-6.333
1 gen 2015 anni
Massimo:
45.56
1 gen 2008 anni
Alla data di osservazione
Valore
Variazione assoluta
La variazione rispetto al valore precedente
1 gen 2003 anni
15.523
+15.523
0.0%
1 gen 2004 anni
22.26
+6.737
43.4%
1 gen 2005 anni
27.935
+5.675
25.49%
1 gen 2006 anni
21.888
-6.047
-21.65%
1 gen 2007 anni
18.454
-3.434
-15.69%
1 gen 2008 anni
45.56
+27.105
146.88%
1 gen 2009 anni
28.571
-16.989
-37.29%
1 gen 2010 anni
4.12
-24.451
-85.58%
1 gen 2011 anni
1.541
-2.579
-62.61%
1 gen 2012 anni
4.117
+2.577
167.25%
1 gen 2013 anni
2.632
-1.485
-36.08%
1 gen 2014 anni
0.089
-2.543
-96.63%
1 gen 2015 anni
-6.333
-6.422
-7.23 Mille.%
1 gen 2016 anni
-1.16
+5.173
-81.68%
Classificazione dei paesi secondo i statistiche attuali per anni