Questa scala temporale mostra un grafico dal 2003 anno al 2016 anno. Kenya. I dati fino ad 2002 anno non disponibili. Il numero di osservazioni attuali secondo i date: 14.
La fonte (nome):
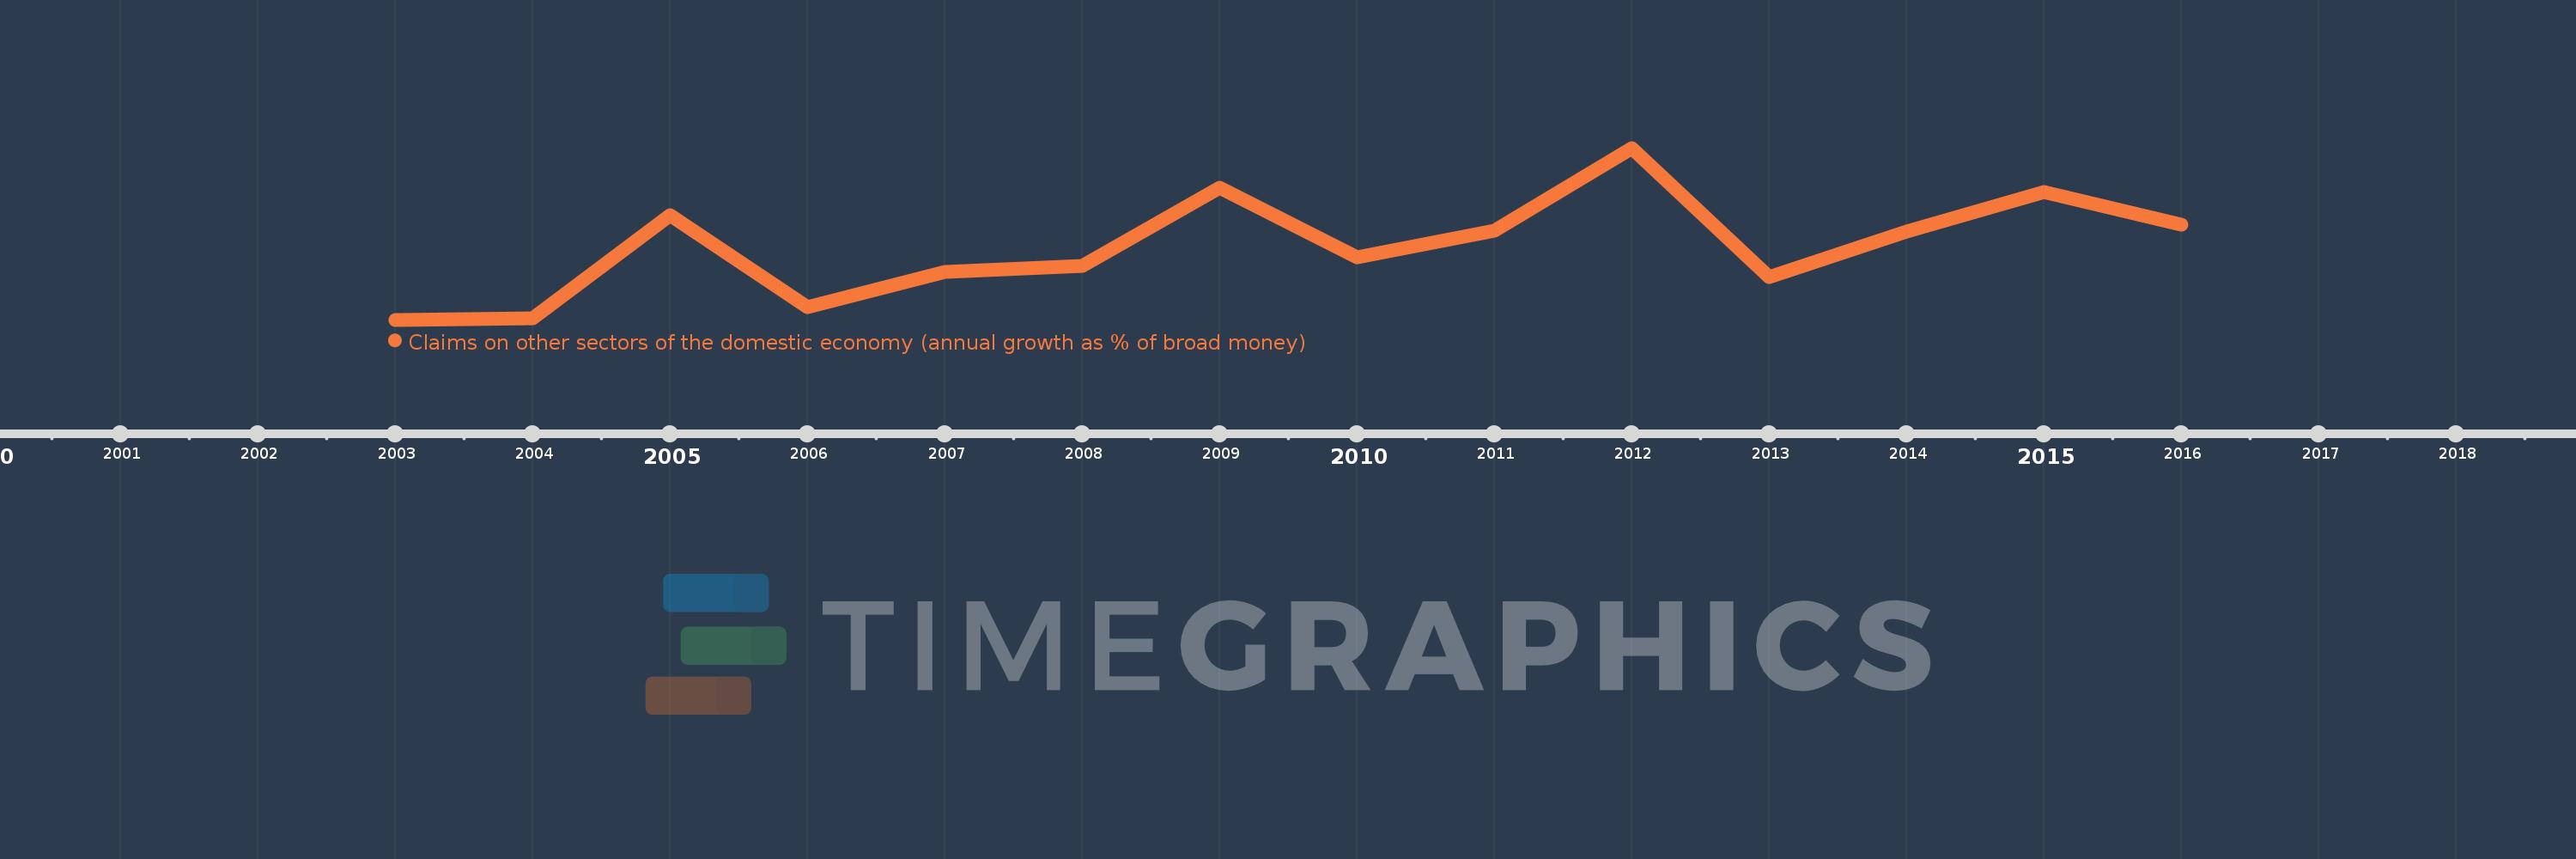
Indicatori dello sviluppo mondiale
La fonte (organizzazione):
International Monetary Fund, International Financial Statistics and data files.
Categorie:
Financial Sector
sono stati aggiornati
23 apr 2017 anni
Indicatori delle variazioni dei valori per anni
In media:
12.669
Minima:
4.697
1 gen 2003 anni
Massimo:
23.333
1 gen 2012 anni
Alla data di osservazione
Valore
Variazione assoluta
La variazione rispetto al valore precedente
1 gen 2003 anni
4.697
+4.697
0.0%
1 gen 2004 anni
4.845
+0.148
3.14%
1 gen 2005 anni
16.004
+11.159
230.32%
1 gen 2006 anni
6.042
-9.962
-62.25%
1 gen 2007 anni
9.887
+3.845
63.64%
1 gen 2008 anni
10.526
+0.639
6.46%
1 gen 2009 anni
19.04
+8.515
80.9%
1 gen 2010 anni
11.515
-7.525
-39.52%
1 gen 2011 anni
14.316
+2.8
24.32%
1 gen 2012 anni
23.333
+9.017
62.99%
1 gen 2013 anni
9.314
-14.018
-60.08%
1 gen 2014 anni
14.258
+4.943
53.07%
1 gen 2015 anni
18.599
+4.341
30.45%
1 gen 2016 anni
14.988
-3.611
-19.41%
Classificazione dei paesi secondo i statistiche attuali per anni