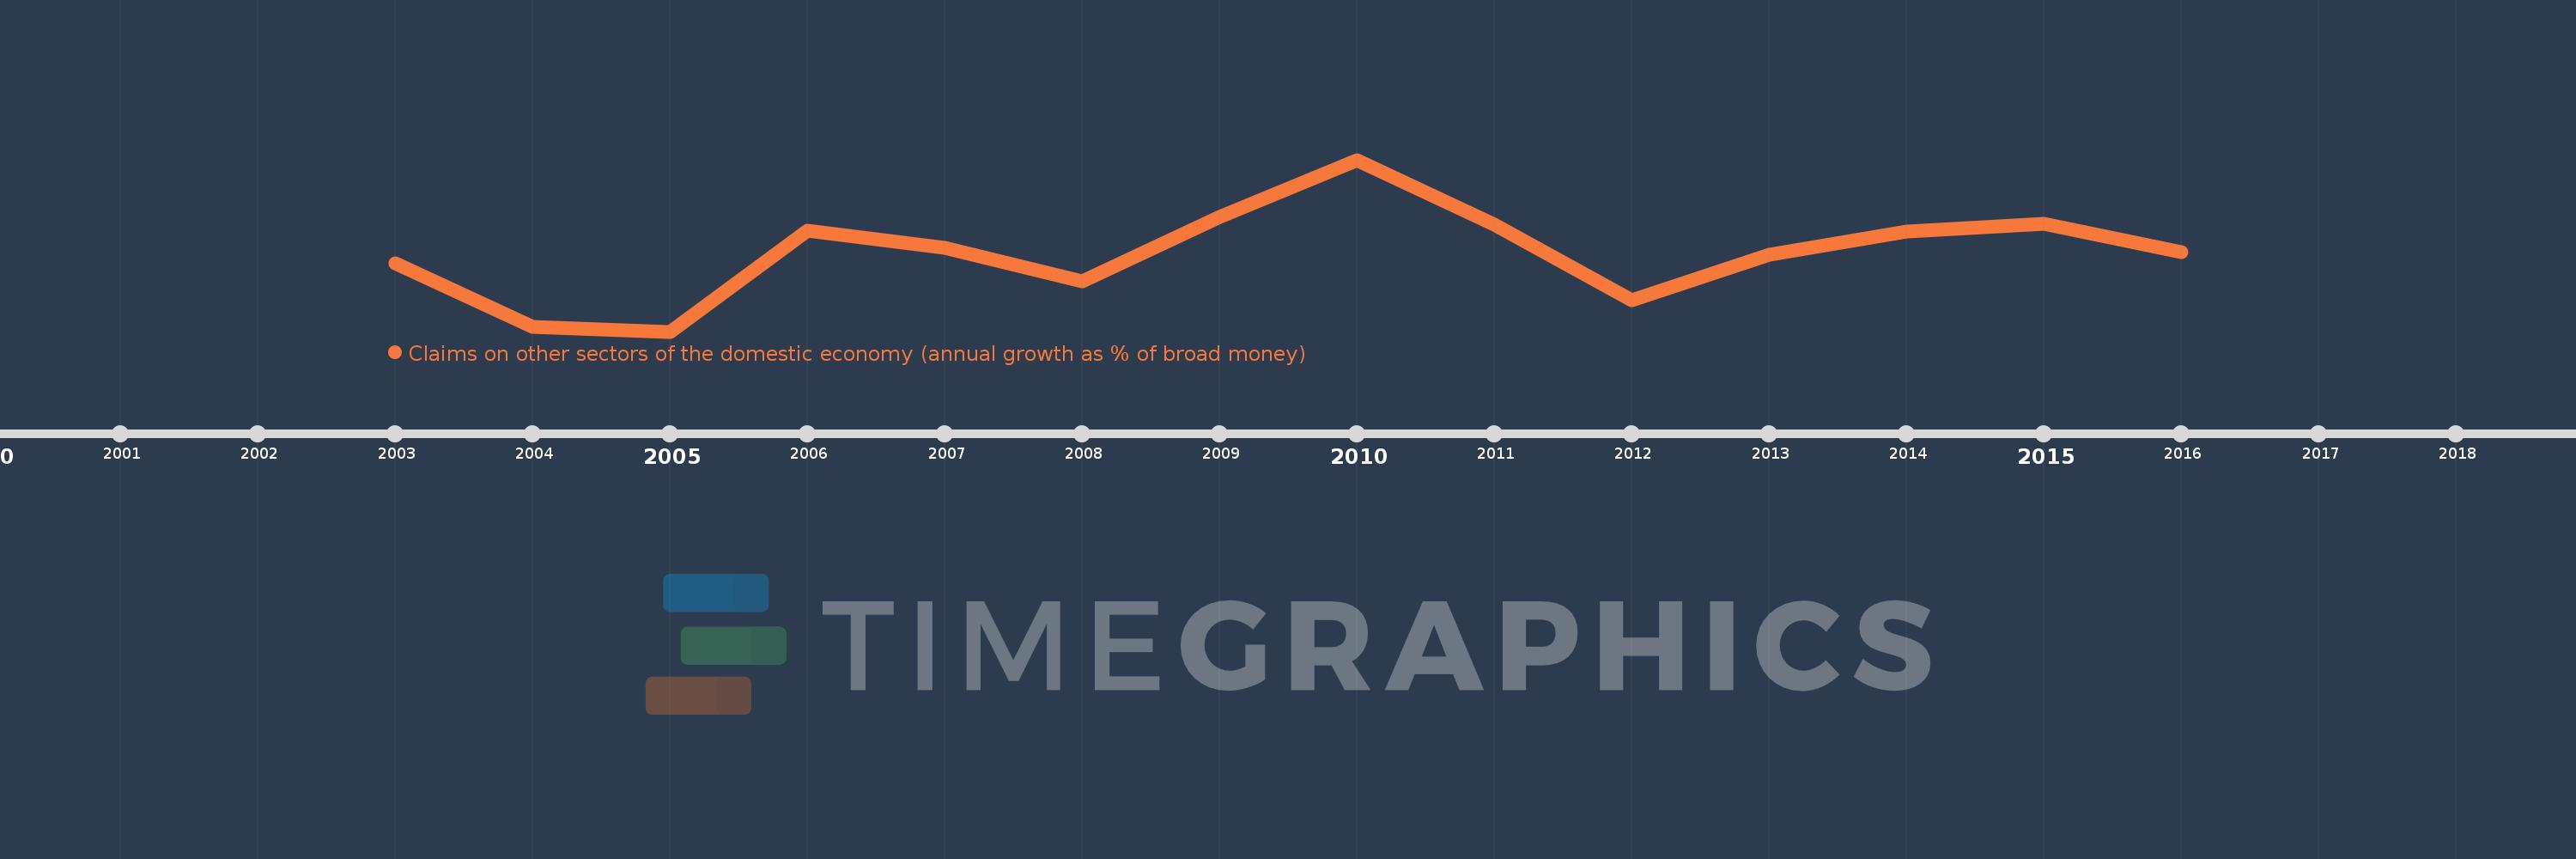
Questa scala temporale mostra un grafico dal 2003 anno al 2016 anno. Mozambique. I dati fino ad 2002 anno non disponibili. Il numero di osservazioni attuali secondo i date: 14.
La fonte (nome):
Indicatori dello sviluppo mondiale
La fonte (organizzazione):
International Monetary Fund, International Financial Statistics and data files.
Categorie:
Financial Sector
sono stati aggiornati
23 apr 2017 anni
Indicatori delle variazioni dei valori per anni
In media:
13.869
Minima:
-1.929
1 gen 2005 anni
Massimo:
32.702
1 gen 2010 anni
Alla data di osservazione
Valore
Variazione assoluta
La variazione rispetto al valore precedente
1 gen 2003 anni
11.899
+11.899
0.0%
1 gen 2004 anni
-0.904
-12.803
-107.6%
1 gen 2005 anni
-1.929
-1.025
113.42%
1 gen 2006 anni
18.499
+20.428
-1.06 Mille.%
1 gen 2007 anni
14.874
-3.625
-19.59%
1 gen 2008 anni
8.126
-6.749
-45.37%
1 gen 2009 anni
21.111
+12.985
159.81%
1 gen 2010 anni
32.702
+11.591
54.9%
1 gen 2011 anni
19.548
-13.154
-40.22%
1 gen 2012 anni
4.407
-15.141
-77.46%
1 gen 2013 anni
13.615
+9.208
208.94%
1 gen 2014 anni
18.189
+4.574
33.59%
1 gen 2015 anni
19.871
+1.683
9.25%
1 gen 2016 anni
14.163
-5.708
-28.72%
Classificazione dei paesi secondo i statistiche attuali per anni