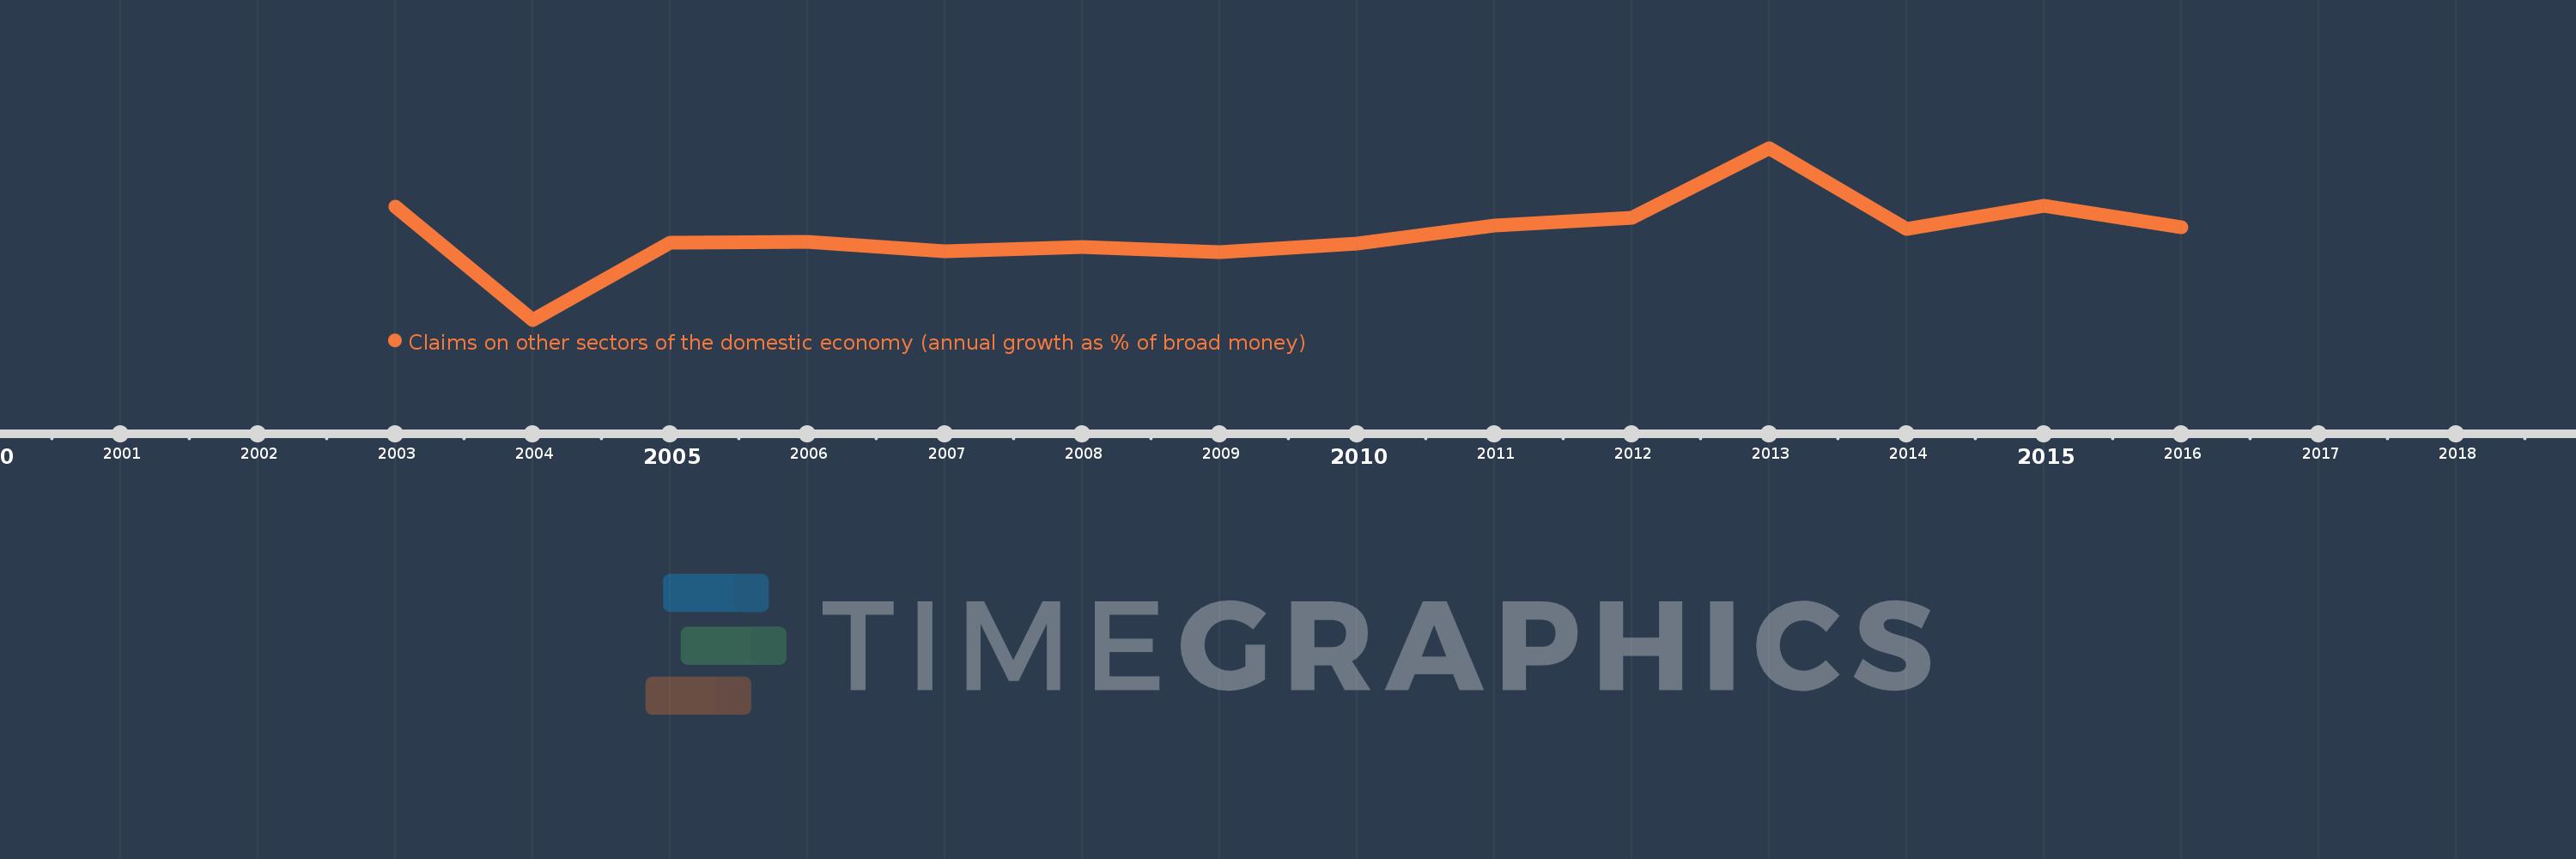
Questa scala temporale mostra un grafico dal 2003 anno al 2016 anno. Myanmar. I dati fino ad 2002 anno non disponibili. Il numero di osservazioni attuali secondo i date: 14.
La fonte (nome):
Indicatori dello sviluppo mondiale
La fonte (organizzazione):
International Monetary Fund, International Financial Statistics and data files.
Categorie:
Financial Sector
sono stati aggiornati
23 apr 2017 anni
Indicatori delle variazioni dei valori per anni
In media:
8.625
Minima:
-18.038
1 gen 2004 anni
Massimo:
34.605
1 gen 2013 anni
Alla data di osservazione
Valore
Variazione assoluta
La variazione rispetto al valore precedente
1 gen 2003 anni
16.508
+16.508
0.0%
1 gen 2004 anni
-18.038
-34.547
-209.27%
1 gen 2005 anni
5.674
+23.712
-131.45%
1 gen 2006 anni
5.709
+0.036
0.63%
1 gen 2007 anni
3.05
-2.659
-46.58%
1 gen 2008 anni
4.304
+1.254
41.1%
1 gen 2009 anni
2.639
-1.664
-38.67%
1 gen 2010 anni
5.189
+2.55
96.6%
1 gen 2011 anni
10.928
+5.739
110.6%
1 gen 2012 anni
13.103
+2.175
19.9%
1 gen 2013 anni
34.605
+21.502
164.1%
1 gen 2014 anni
9.753
-24.852
-71.82%
1 gen 2015 anni
16.931
+7.177
73.59%
1 gen 2016 anni
10.4
-6.531
-38.57%
Classificazione dei paesi secondo i statistiche attuali per anni