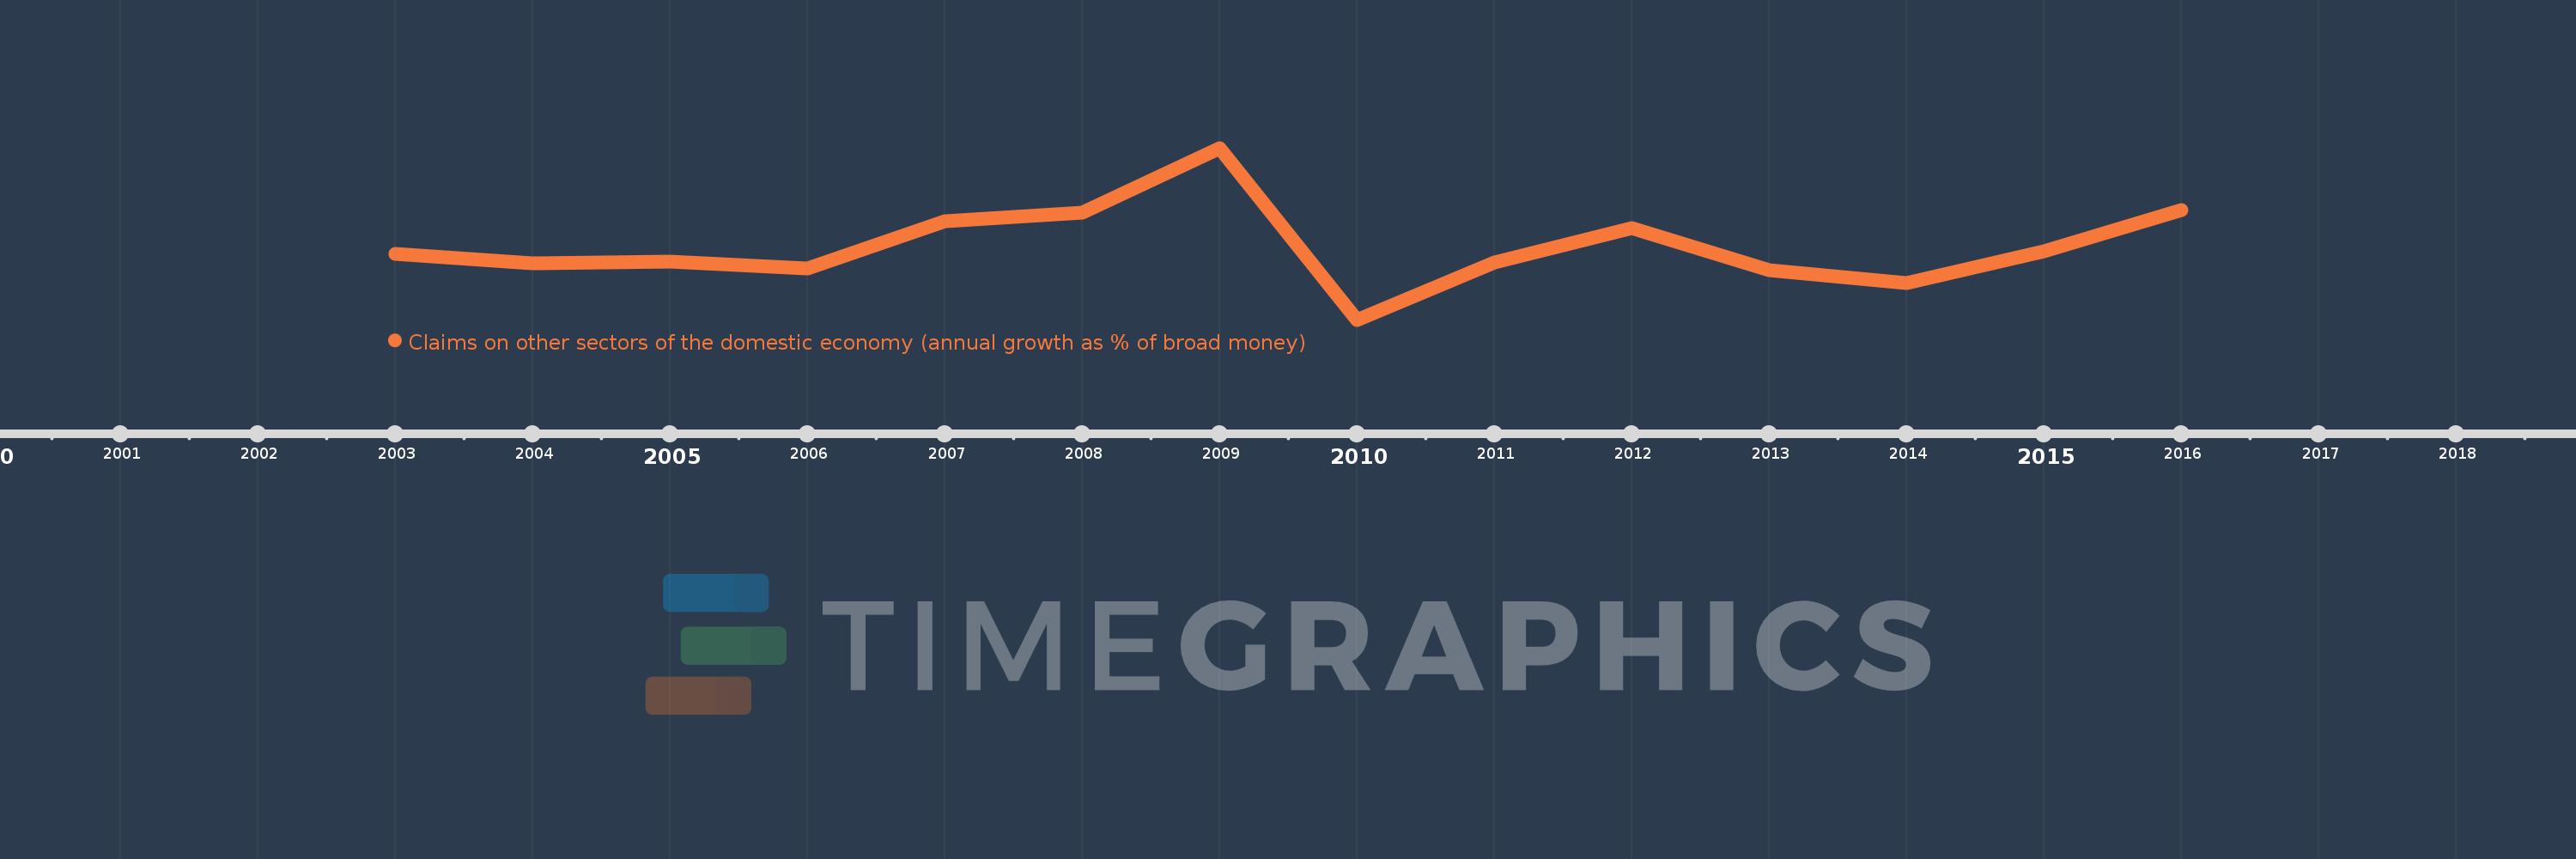
Questa scala temporale mostra un grafico dal 2003 anno al 2016 anno. Tanzania. I dati fino ad 2002 anno non disponibili. Il numero di osservazioni attuali secondo i date: 14.
La fonte (nome):
Indicatori dello sviluppo mondiale
La fonte (organizzazione):
International Monetary Fund, International Financial Statistics and data files.
Categorie:
Financial Sector
sono stati aggiornati
23 apr 2017 anni
Indicatori delle variazioni dei valori per anni
In media:
12.963
Minima:
5.842
1 gen 2010 anni
Massimo:
22.575
1 gen 2009 anni
Alla data di osservazione
Valore
Variazione assoluta
La variazione rispetto al valore precedente
1 gen 2003 anni
12.247
+12.247
0.0%
1 gen 2004 anni
11.378
-0.87
-7.1%
1 gen 2005 anni
11.523
+0.145
1.27%
1 gen 2006 anni
10.83
-0.693
-6.01%
1 gen 2007 anni
15.429
+4.6
42.47%
1 gen 2008 anni
16.286
+0.856
5.55%
1 gen 2009 anni
22.575
+6.289
38.62%
1 gen 2010 anni
5.842
-16.733
-74.12%
1 gen 2011 anni
11.388
+5.546
94.94%
1 gen 2012 anni
14.806
+3.418
30.02%
1 gen 2013 anni
10.66
-4.146
-28.0%
1 gen 2014 anni
9.427
-1.233
-11.57%
1 gen 2015 anni
12.539
+3.112
33.02%
1 gen 2016 anni
16.549
+4.01
31.98%
Classificazione dei paesi secondo i statistiche attuali per anni