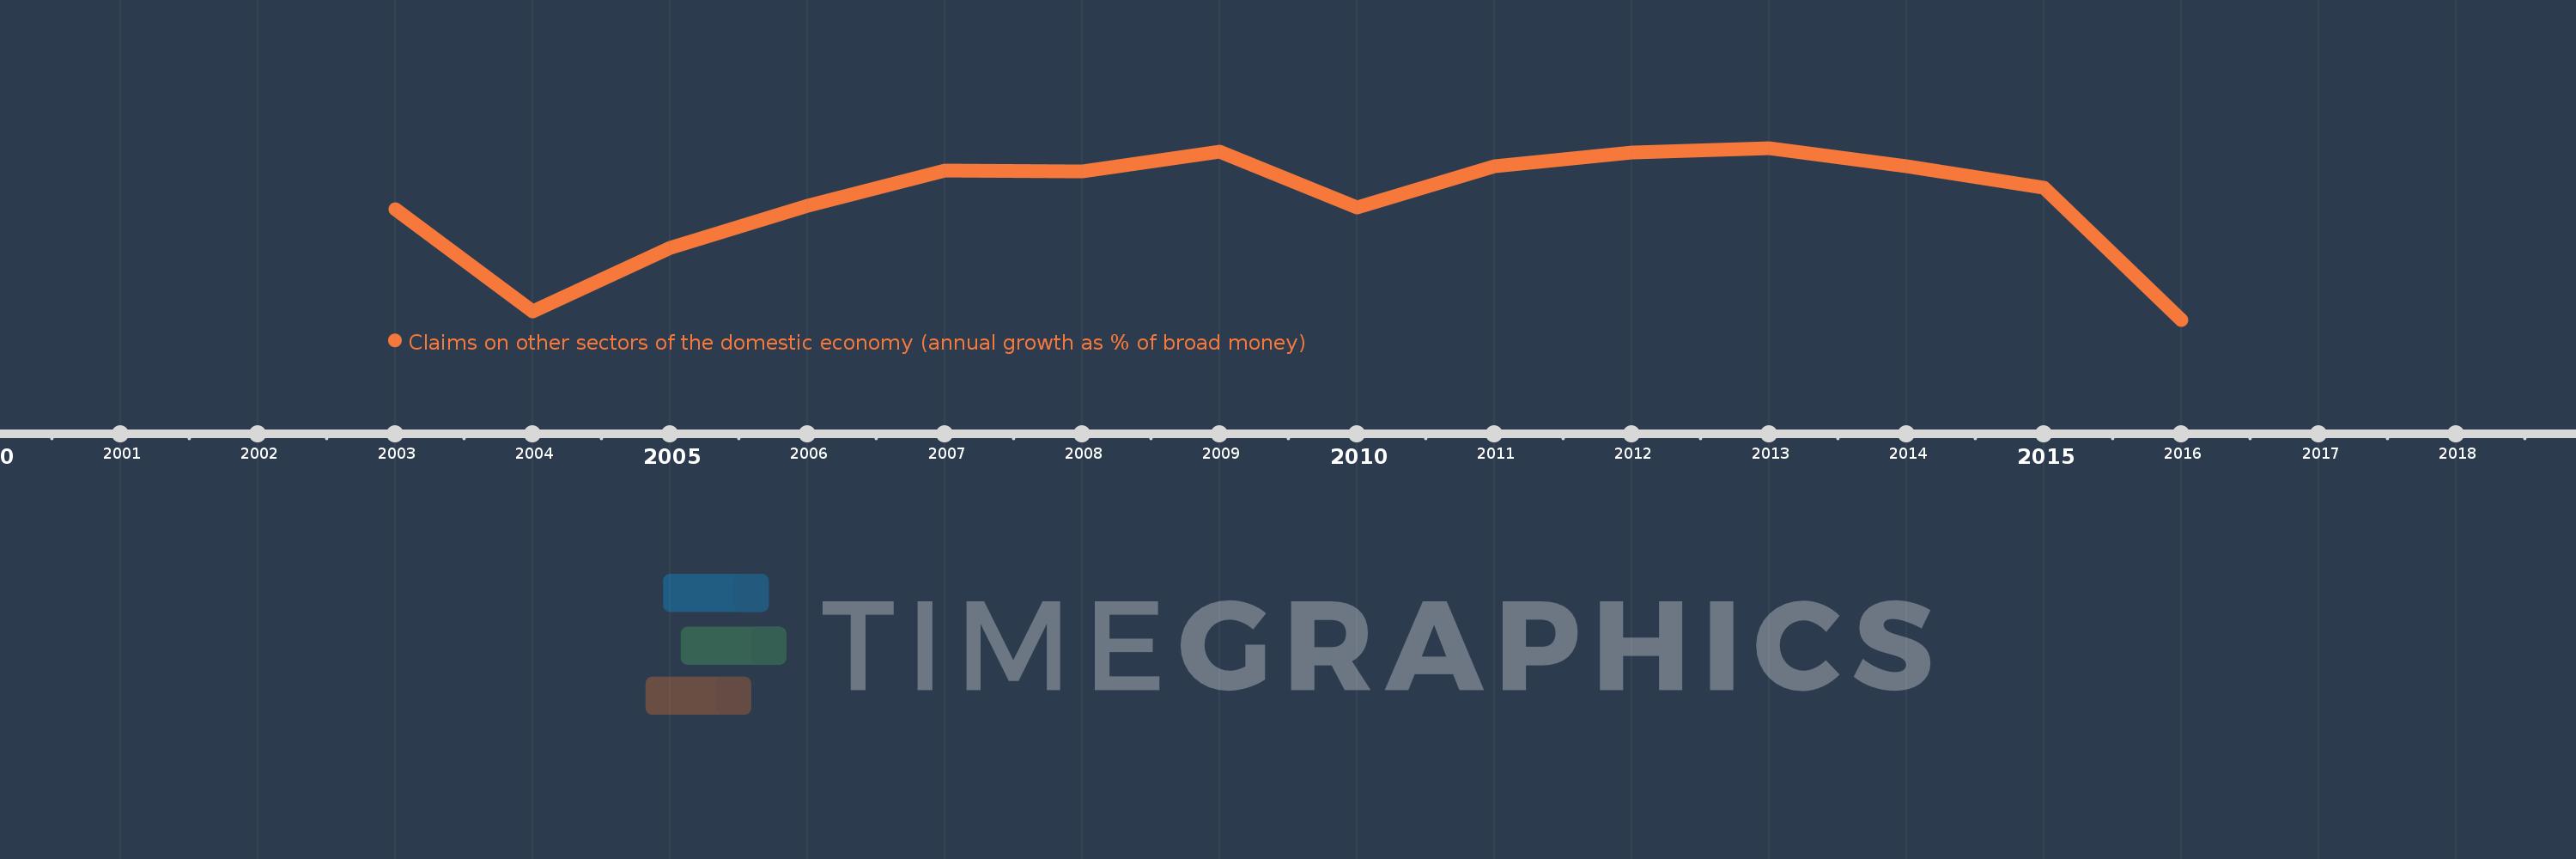
Questa scala temporale mostra un grafico dal 2003 anno al 2016 anno. Guyana. I dati fino ad 2002 anno non disponibili. Il numero di osservazioni attuali secondo i date: 14.
La fonte (nome):
Indicatori dello sviluppo mondiale
La fonte (organizzazione):
International Monetary Fund, International Financial Statistics and data files.
Categorie:
Financial Sector
sono stati aggiornati
23 apr 2017 anni
Indicatori delle variazioni dei valori per anni
In media:
3.893
Minima:
-7.499
1 gen 2016 anni
Massimo:
9.0
1 gen 2013 anni
Alla data di osservazione
Valore
Variazione assoluta
La variazione rispetto al valore precedente
1 gen 2003 anni
3.083
+3.083
0.0%
1 gen 2004 anni
-6.691
-9.774
-316.99%
1 gen 2005 anni
-0.569
+6.122
-91.49%
1 gen 2006 anni
3.455
+4.025
-707.04%
1 gen 2007 anni
6.821
+3.366
97.4%
1 gen 2008 anni
6.73
-0.091
-1.33%
1 gen 2009 anni
8.666
+1.936
28.77%
1 gen 2010 anni
3.276
-5.39
-62.19%
1 gen 2011 anni
7.228
+3.952
120.62%
1 gen 2012 anni
8.553
+1.325
18.33%
1 gen 2013 anni
9.0
+0.447
5.22%
1 gen 2014 anni
7.237
-1.763
-19.59%
1 gen 2015 anni
5.215
-2.022
-27.94%
1 gen 2016 anni
-7.499
-12.713
-243.79%
Classificazione dei paesi secondo i statistiche attuali per anni