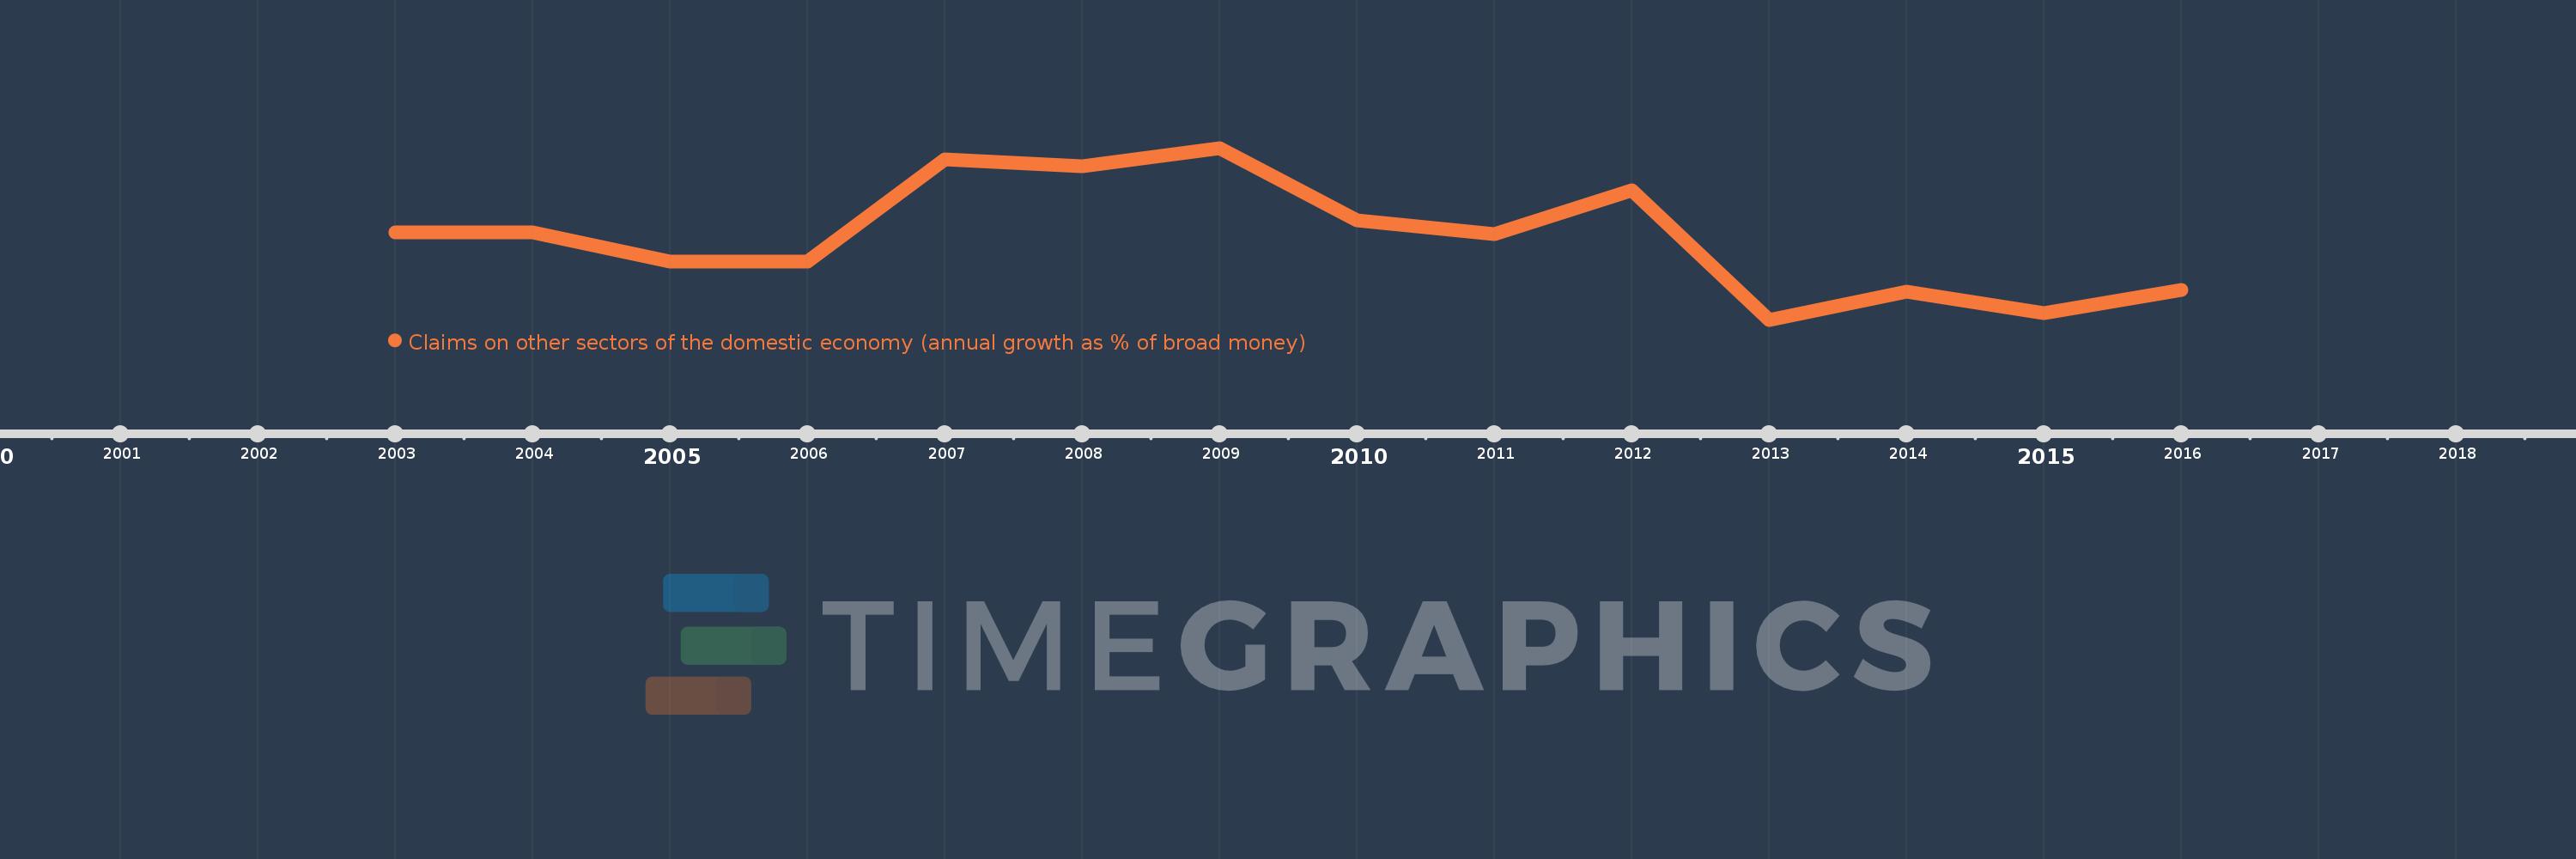
Questa scala temporale mostra un grafico dal 2003 anno al 2016 anno. Cabo Verde. I dati fino ad 2002 anno non disponibili. Il numero di osservazioni attuali secondo i date: 14.
La fonte (nome):
Indicatori dello sviluppo mondiale
La fonte (organizzazione):
International Monetary Fund, International Financial Statistics and data files.
Categorie:
Financial Sector
sono stati aggiornati
23 apr 2017 anni
Indicatori delle variazioni dei valori per anni
In media:
7.011
Minima:
-0.834
1 gen 2013 anni
Massimo:
15.487
1 gen 2009 anni
Alla data di osservazione
Valore
Variazione assoluta
La variazione rispetto al valore precedente
1 gen 2003 anni
7.436
+7.436
0.0%
1 gen 2004 anni
7.481
+0.045
0.61%
1 gen 2005 anni
4.669
-2.812
-37.59%
1 gen 2006 anni
4.697
+0.029
0.61%
1 gen 2007 anni
14.387
+9.69
206.28%
1 gen 2008 anni
13.763
-0.625
-4.34%
1 gen 2009 anni
15.487
+1.725
12.53%
1 gen 2010 anni
8.638
-6.849
-44.22%
1 gen 2011 anni
7.265
-1.373
-15.9%
1 gen 2012 anni
11.5
+4.236
58.3%
1 gen 2013 anni
-0.834
-12.334
-107.25%
1 gen 2014 anni
1.833
+2.667
-319.89%
1 gen 2015 anni
-0.181
-2.014
-109.88%
1 gen 2016 anni
2.011
+2.192
-1.21 Mille.%
Classificazione dei paesi secondo i statistiche attuali per anni