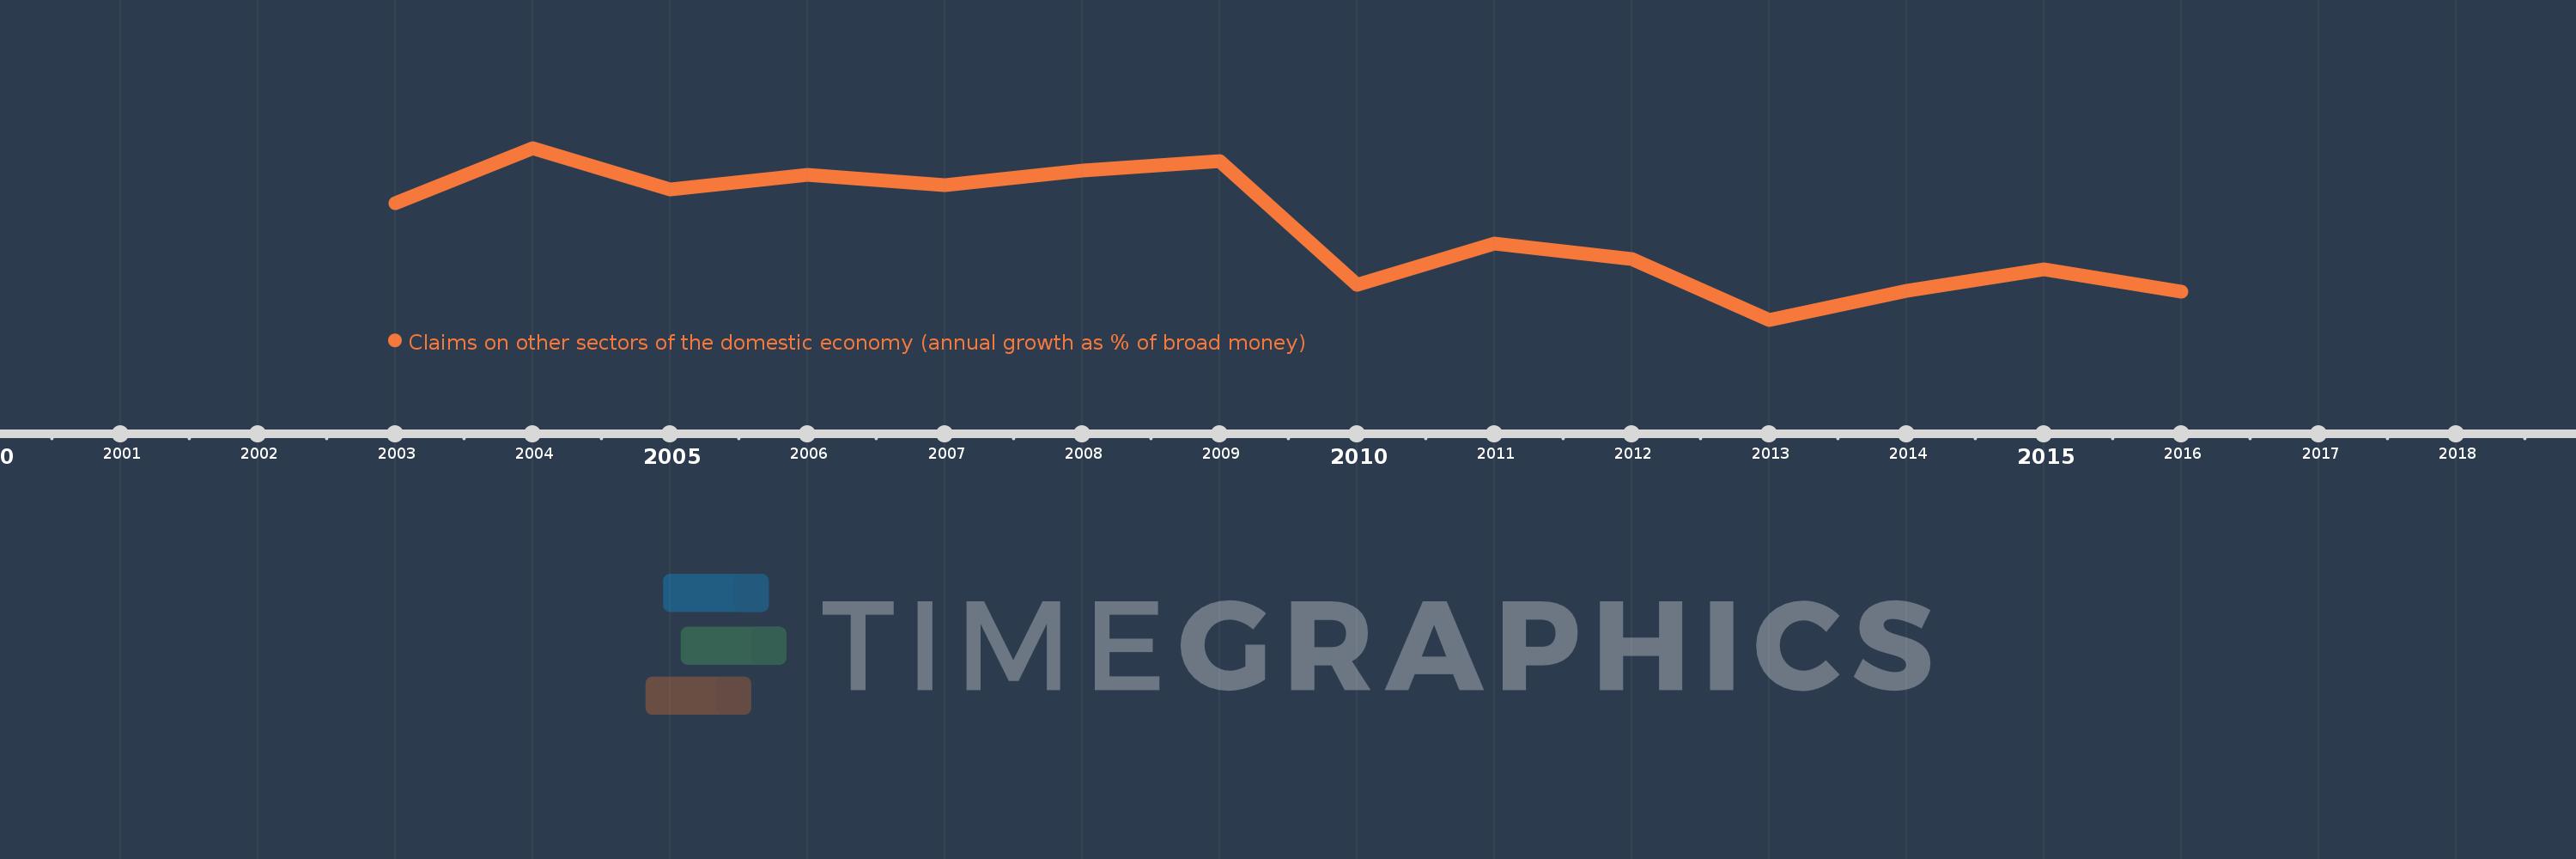
Questa scala temporale mostra un grafico dal 2003 anno al 2016 anno. Hungary. I dati fino ad 2002 anno non disponibili. Il numero di osservazioni attuali secondo i date: 14.
La fonte (nome):
Indicatori dello sviluppo mondiale
La fonte (organizzazione):
International Monetary Fund, International Financial Statistics and data files.
Categorie:
Financial Sector
sono stati aggiornati
23 apr 2017 anni
Indicatori delle variazioni dei valori per anni
In media:
7.823
Minima:
-14.38
1 gen 2013 anni
Massimo:
27.134
1 gen 2004 anni
Alla data di osservazione
Valore
Variazione assoluta
La variazione rispetto al valore precedente
1 gen 2003 anni
13.858
+13.858
0.0%
1 gen 2004 anni
27.134
+13.276
95.8%
1 gen 2005 anni
17.058
-10.076
-37.13%
1 gen 2006 anni
20.614
+3.556
20.84%
1 gen 2007 anni
18.217
-2.396
-11.62%
1 gen 2008 anni
21.688
+3.47
19.05%
1 gen 2009 anni
23.999
+2.311
10.65%
1 gen 2010 anni
-6.015
-30.013
-125.06%
1 gen 2011 anni
4.002
+10.017
-166.54%
1 gen 2012 anni
0.384
-3.618
-90.41%
1 gen 2013 anni
-14.38
-14.764
-3.85 Mille.%
1 gen 2014 anni
-7.284
+7.096
-49.35%
1 gen 2015 anni
-2.095
+5.189
-71.24%
1 gen 2016 anni
-7.663
-5.568
265.83%
Classificazione dei paesi secondo i statistiche attuali per anni