Questa scala temporale mostra un grafico dal 2003 anno al 2016 anno. Samoa. I dati fino ad 2002 anno non disponibili. Il numero di osservazioni attuali secondo i date: 14.
La fonte (nome):
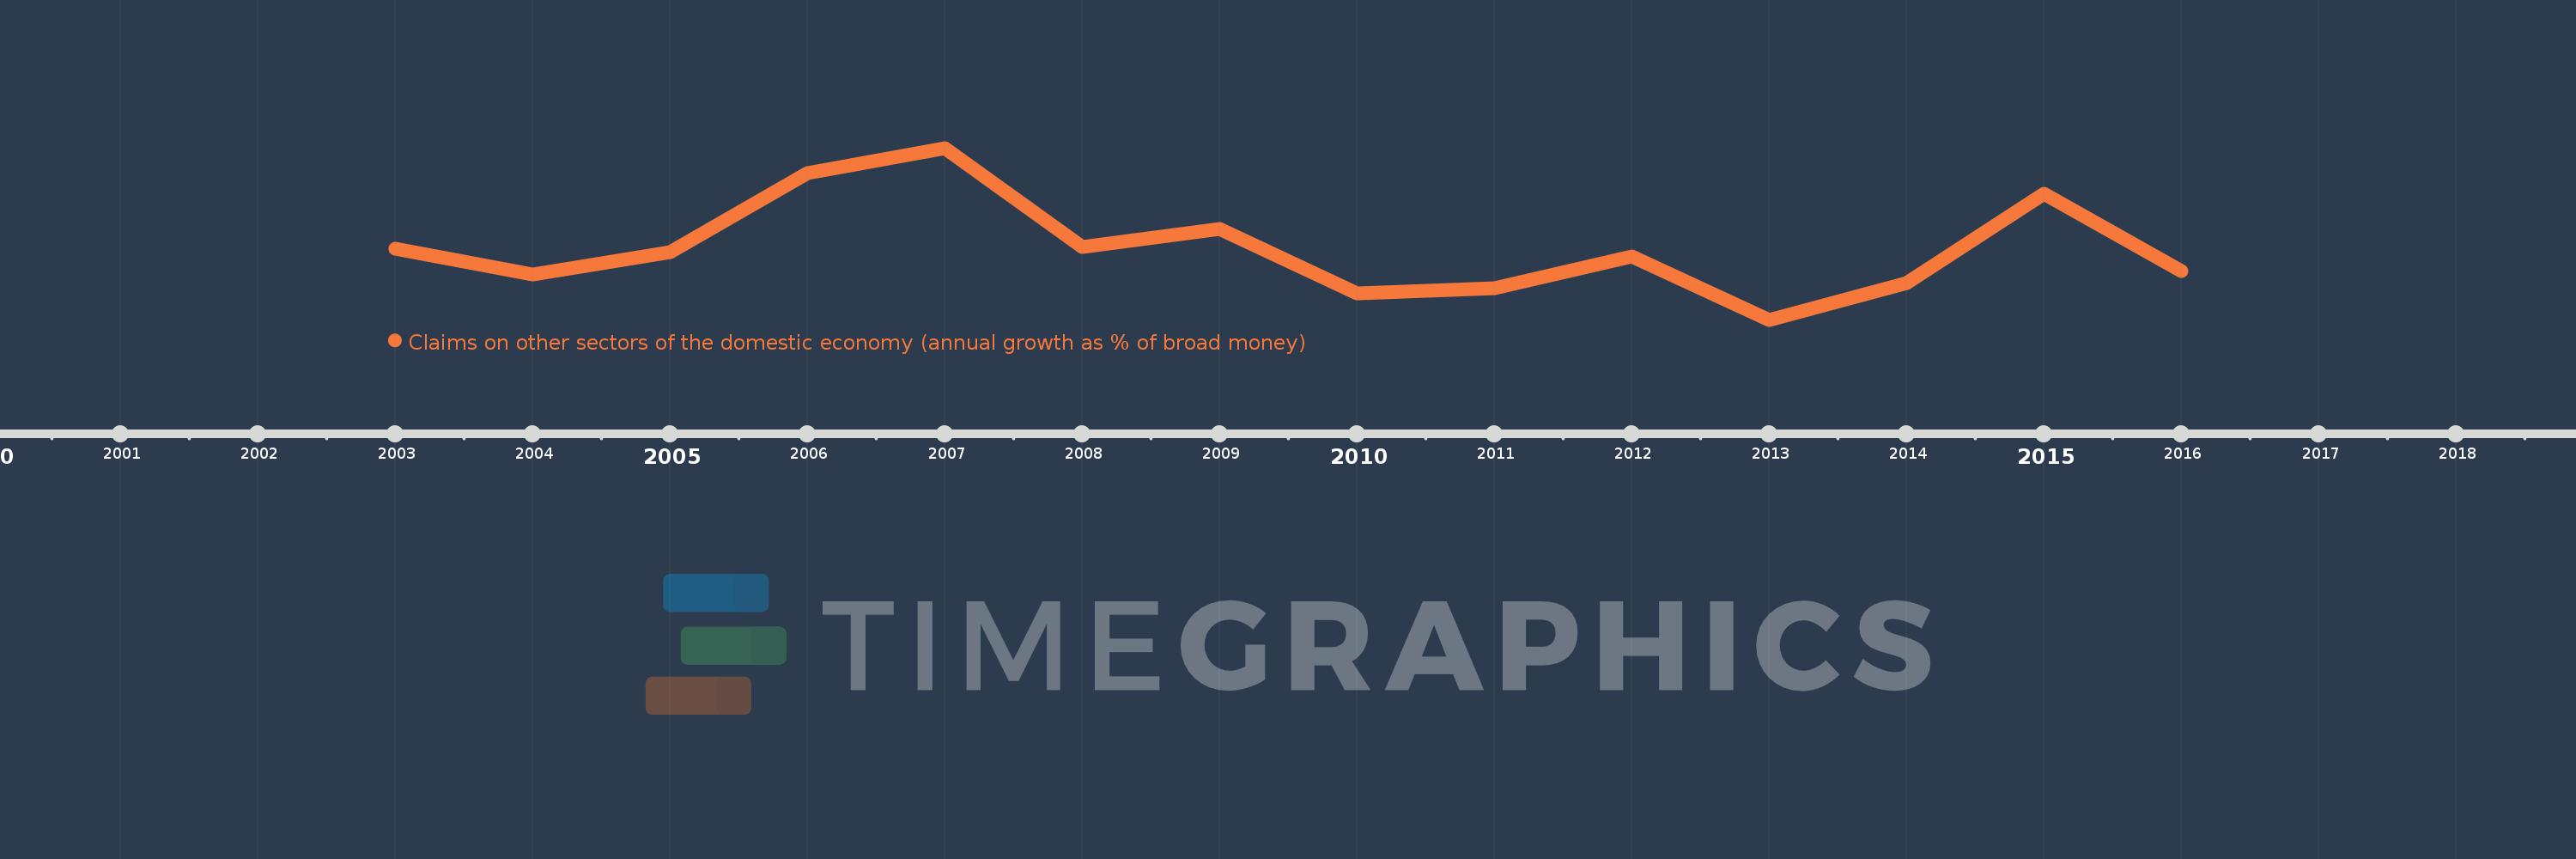
Indicatori dello sviluppo mondiale
La fonte (organizzazione):
International Monetary Fund, International Financial Statistics and data files.
Categorie:
Financial Sector
sono stati aggiornati
23 apr 2017 anni
Indicatori delle variazioni dei valori per anni
In media:
9.784
Minima:
-0.54
1 gen 2013 anni
Massimo:
24.375
1 gen 2007 anni
Alla data di osservazione
Valore
Variazione assoluta
La variazione rispetto al valore precedente
1 gen 2003 anni
9.73
+9.73
0.0%
1 gen 2004 anni
5.967
-3.763
-38.67%
1 gen 2005 anni
9.273
+3.307
55.42%
1 gen 2006 anni
20.685
+11.411
123.05%
1 gen 2007 anni
24.375
+3.69
17.84%
1 gen 2008 anni
9.958
-14.417
-59.15%
1 gen 2009 anni
12.571
+2.612
26.23%
1 gen 2010 anni
3.28
-9.29
-73.9%
1 gen 2011 anni
4.024
+0.744
22.68%
1 gen 2012 anni
8.648
+4.624
114.9%
1 gen 2013 anni
-0.54
-9.189
-106.25%
1 gen 2014 anni
4.77
+5.31
-982.6%
1 gen 2015 anni
17.768
+12.998
272.52%
1 gen 2016 anni
6.465
-11.302
-63.61%
Classificazione dei paesi secondo i statistiche attuali per anni