Questa scala temporale mostra un grafico dal 2003 anno al 2016 anno. Burkina Faso. I dati fino ad 2002 anno non disponibili. Il numero di osservazioni attuali secondo i date: 14.
La fonte (nome):
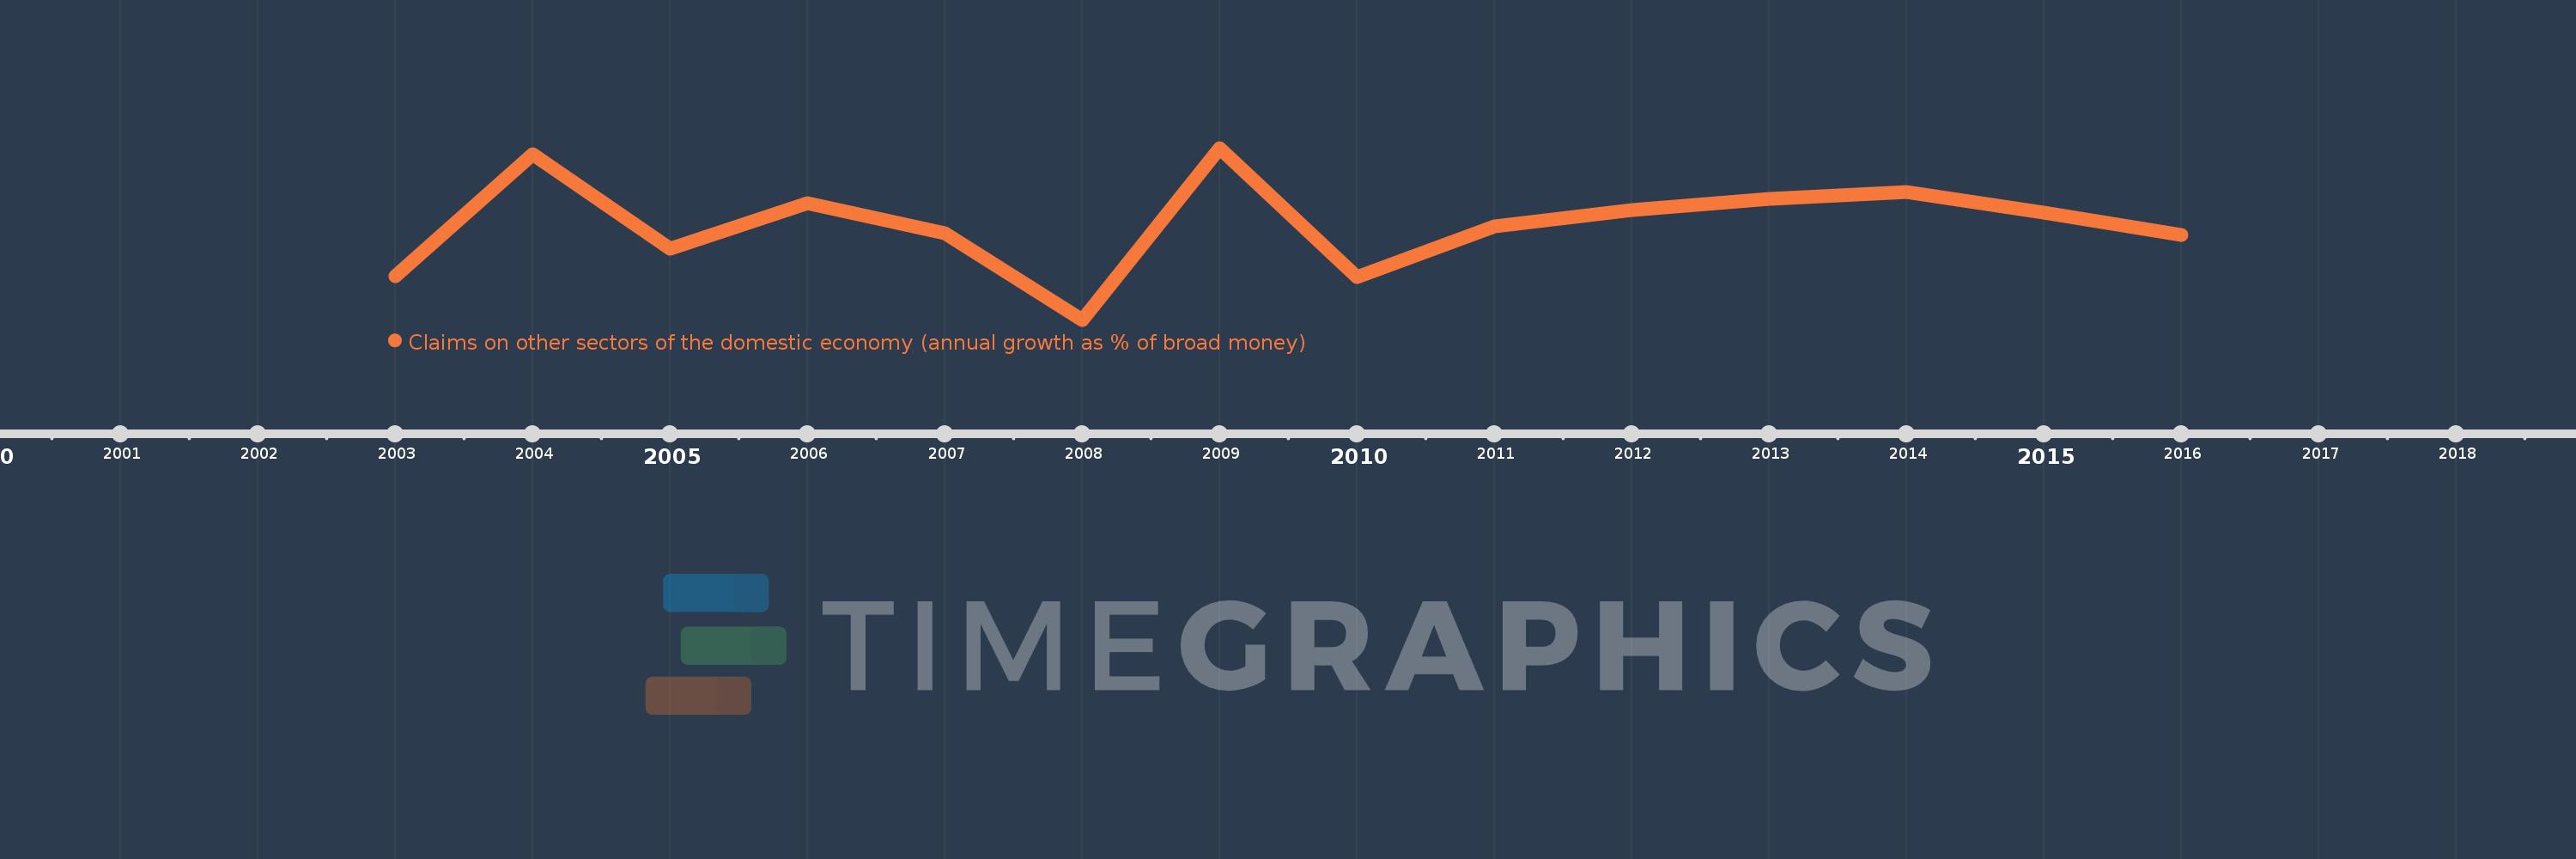
Indicatori dello sviluppo mondiale
La fonte (organizzazione):
International Monetary Fund, International Financial Statistics and data files.
Categorie:
Financial Sector
sono stati aggiornati
23 apr 2017 anni
Indicatori delle variazioni dei valori per anni
In media:
11.3
Minima:
-9.324
1 gen 2008 anni
Massimo:
27.656
1 gen 2009 anni
Alla data di osservazione
Valore
Variazione assoluta
La variazione rispetto al valore precedente
1 gen 2003 anni
0.004
+0.004
0.0%
1 gen 2004 anni
26.317
+26.313
588.94 Mille.%
1 gen 2005 anni
6.035
-20.282
-77.07%
1 gen 2006 anni
15.683
+9.648
159.87%
1 gen 2007 anni
9.376
-6.307
-40.22%
1 gen 2008 anni
-9.324
-18.7
-199.45%
1 gen 2009 anni
27.656
+36.98
-396.61%
1 gen 2010 anni
-0.092
-27.748
-100.33%
1 gen 2011 anni
10.684
+10.776
-11.78 Mille.%
1 gen 2012 anni
14.202
+3.517
32.92%
1 gen 2013 anni
16.769
+2.567
18.07%
1 gen 2014 anni
18.255
+1.486
8.86%
1 gen 2015 anni
13.665
-4.59
-25.14%
1 gen 2016 anni
8.965
-4.7
-34.39%
Classificazione dei paesi secondo i statistiche attuali per anni