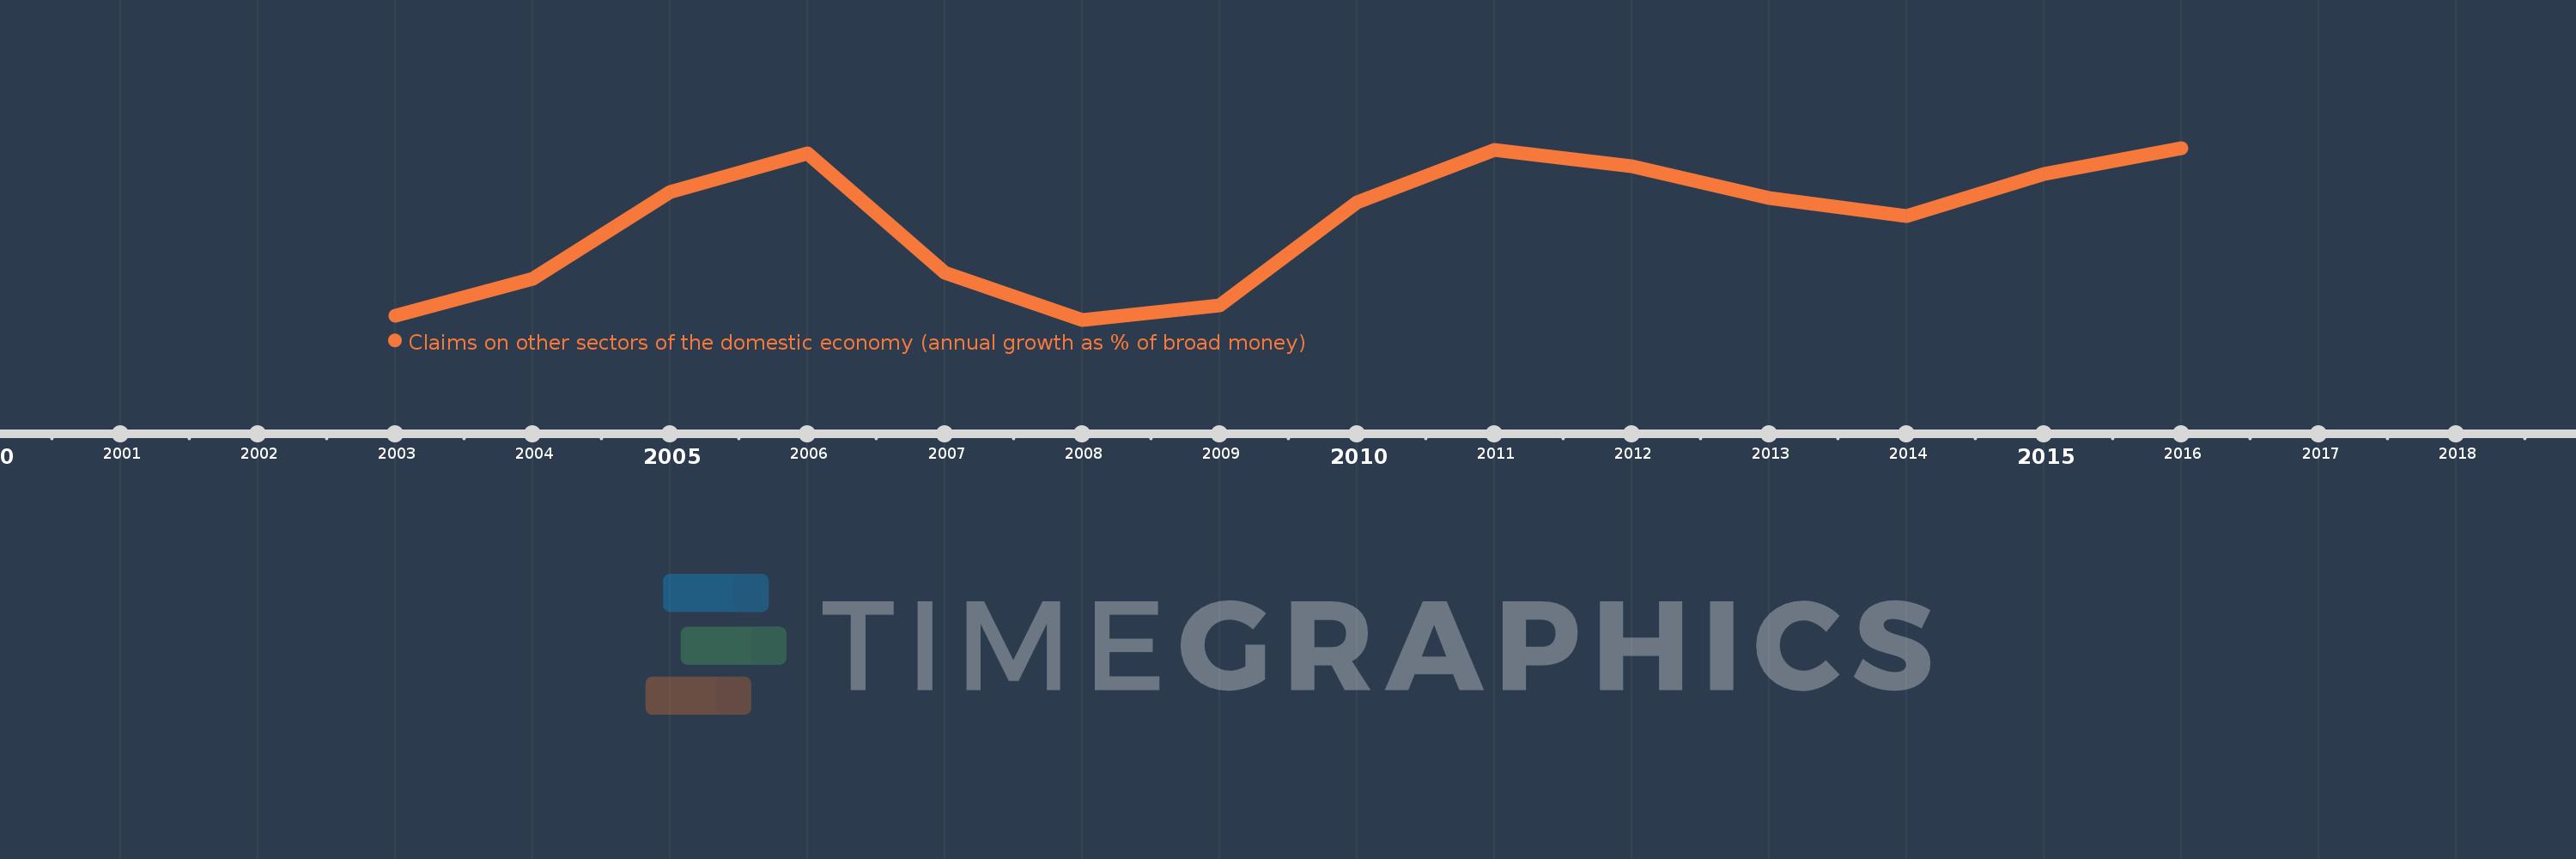
Questa scala temporale mostra un grafico dal 2003 anno al 2016 anno. West Bank and Gaza. I dati fino ad 2002 anno non disponibili. Il numero di osservazioni attuali secondo i date: 14.
La fonte (nome):
Indicatori dello sviluppo mondiale
La fonte (organizzazione):
International Monetary Fund, International Financial Statistics and data files.
Categorie:
Financial Sector
sono stati aggiornati
23 apr 2017 anni
Indicatori delle variazioni dei valori per anni
In media:
4.358
Minima:
-2.091
1 gen 2008 anni
Massimo:
9.113
1 gen 2016 anni
Alla data di osservazione
Valore
Variazione assoluta
La variazione rispetto al valore precedente
1 gen 2003 anni
-1.829
-1.829
0.0%
1 gen 2004 anni
0.6
+2.429
-132.79%
1 gen 2005 anni
6.237
+5.637
939.97%
1 gen 2006 anni
8.766
+2.529
40.55%
1 gen 2007 anni
0.974
-7.792
-88.89%
1 gen 2008 anni
-2.091
-3.065
-314.67%
1 gen 2009 anni
-1.175
+0.916
-43.8%
1 gen 2010 anni
5.539
+6.714
-571.42%
1 gen 2011 anni
8.992
+3.452
62.32%
1 gen 2012 anni
7.92
-1.071
-11.92%
1 gen 2013 anni
5.833
-2.087
-26.36%
1 gen 2014 anni
4.698
-1.134
-19.45%
1 gen 2015 anni
7.428
+2.73
58.1%
1 gen 2016 anni
9.113
+1.685
22.69%
Classificazione dei paesi secondo i statistiche attuali per anni