Questa scala temporale mostra un grafico dal 2003 anno al 2016 anno. South Africa. I dati fino ad 2002 anno non disponibili. Il numero di osservazioni attuali secondo i date: 14.
La fonte (nome):
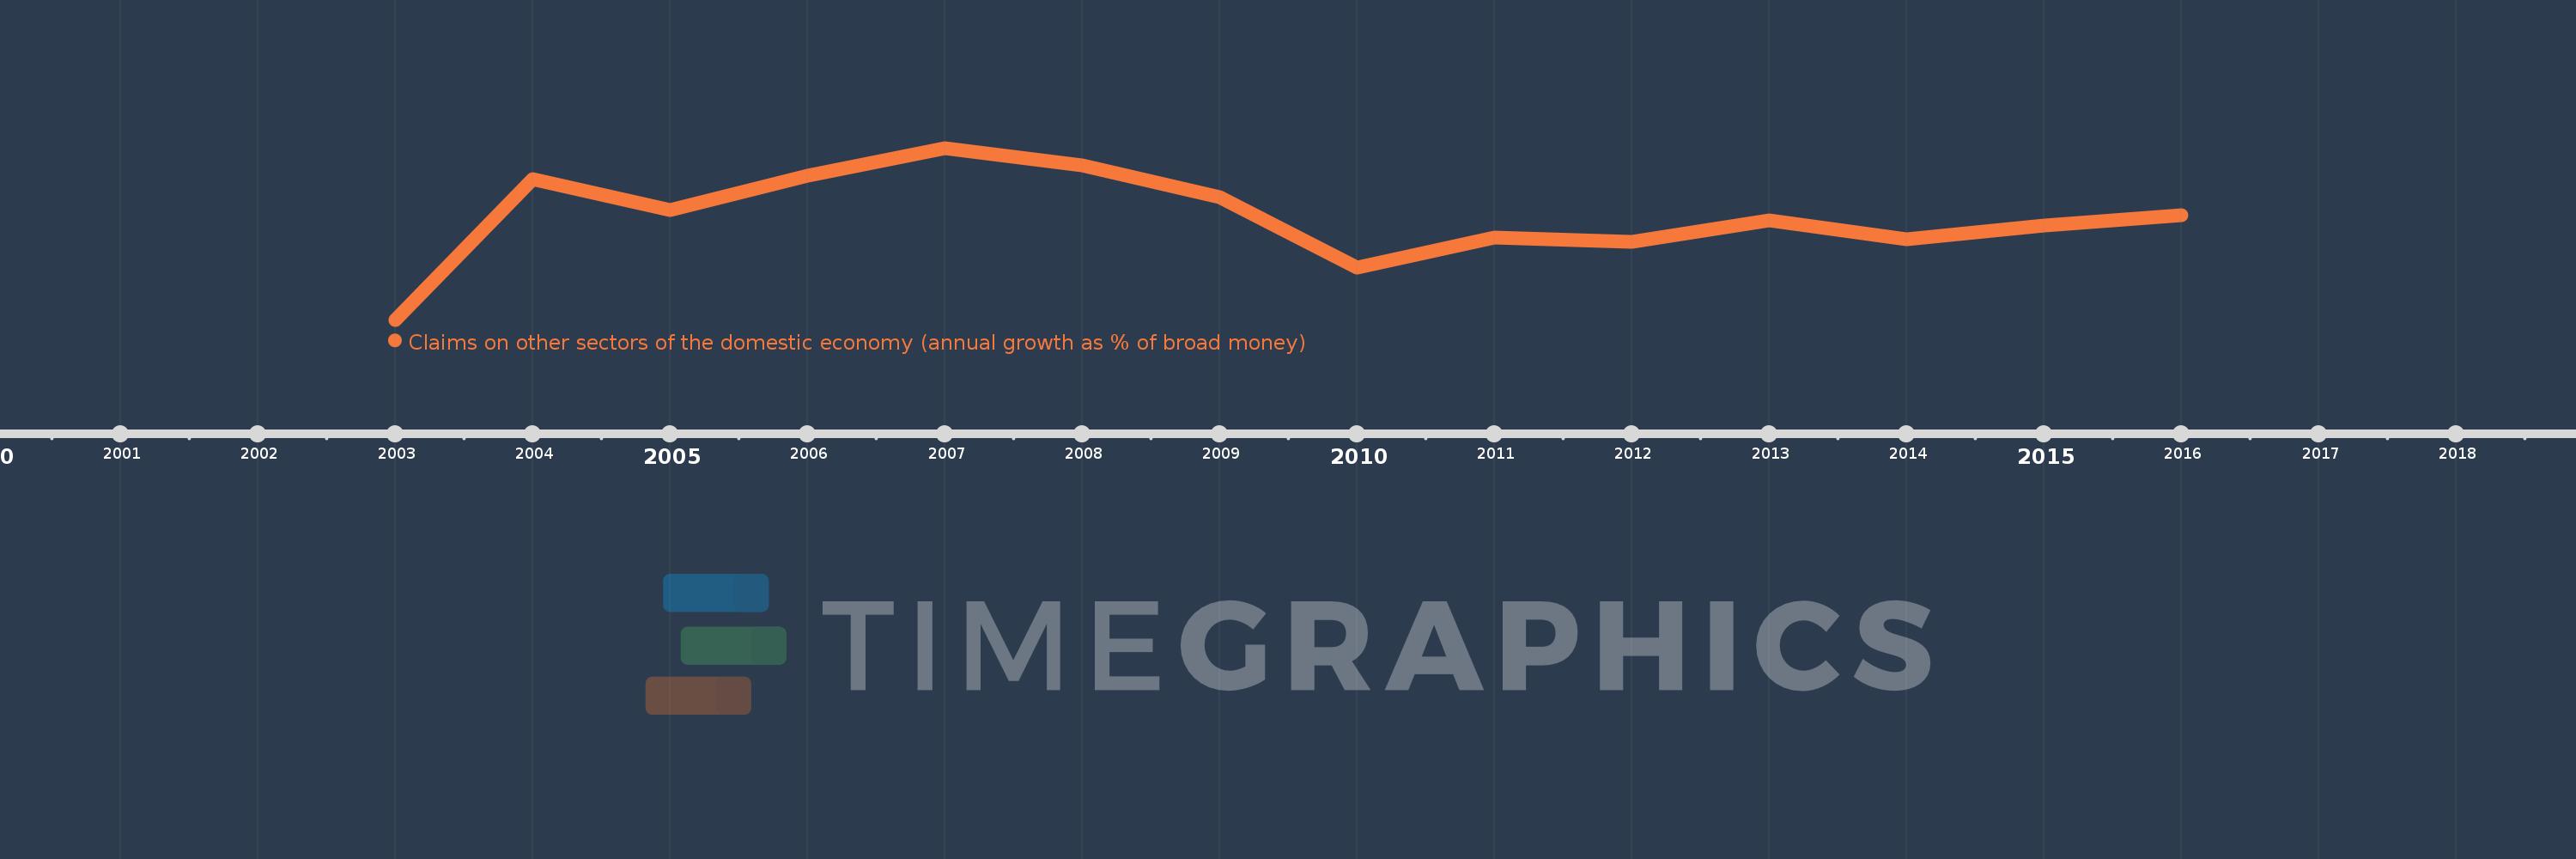
Indicatori dello sviluppo mondiale
La fonte (organizzazione):
International Monetary Fund, International Financial Statistics and data files.
Categorie:
Financial Sector
sono stati aggiornati
23 apr 2017 anni
Indicatori delle variazioni dei valori per anni
In media:
11.42
Minima:
-11.792
1 gen 2003 anni
Massimo:
27.171
1 gen 2007 anni
Alla data di osservazione
Valore
Variazione assoluta
La variazione rispetto al valore precedente
1 gen 2003 anni
-11.792
-11.792
0.0%
1 gen 2004 anni
20.097
+31.889
-270.43%
1 gen 2005 anni
12.994
-7.103
-35.34%
1 gen 2006 anni
20.934
+7.94
61.11%
1 gen 2007 anni
27.171
+6.237
29.79%
1 gen 2008 anni
23.233
-3.938
-14.49%
1 gen 2009 anni
15.939
-7.294
-31.4%
1 gen 2010 anni
0.124
-15.814
-99.22%
1 gen 2011 anni
6.821
+6.697
5.38 Mille.%
1 gen 2012 anni
5.884
-0.937
-13.74%
1 gen 2013 anni
10.68
+4.796
81.51%
1 gen 2014 anni
6.41
-4.269
-39.98%
1 gen 2015 anni
9.542
+3.132
48.86%
1 gen 2016 anni
11.842
+2.299
24.09%
Classificazione dei paesi secondo i statistiche attuali per anni