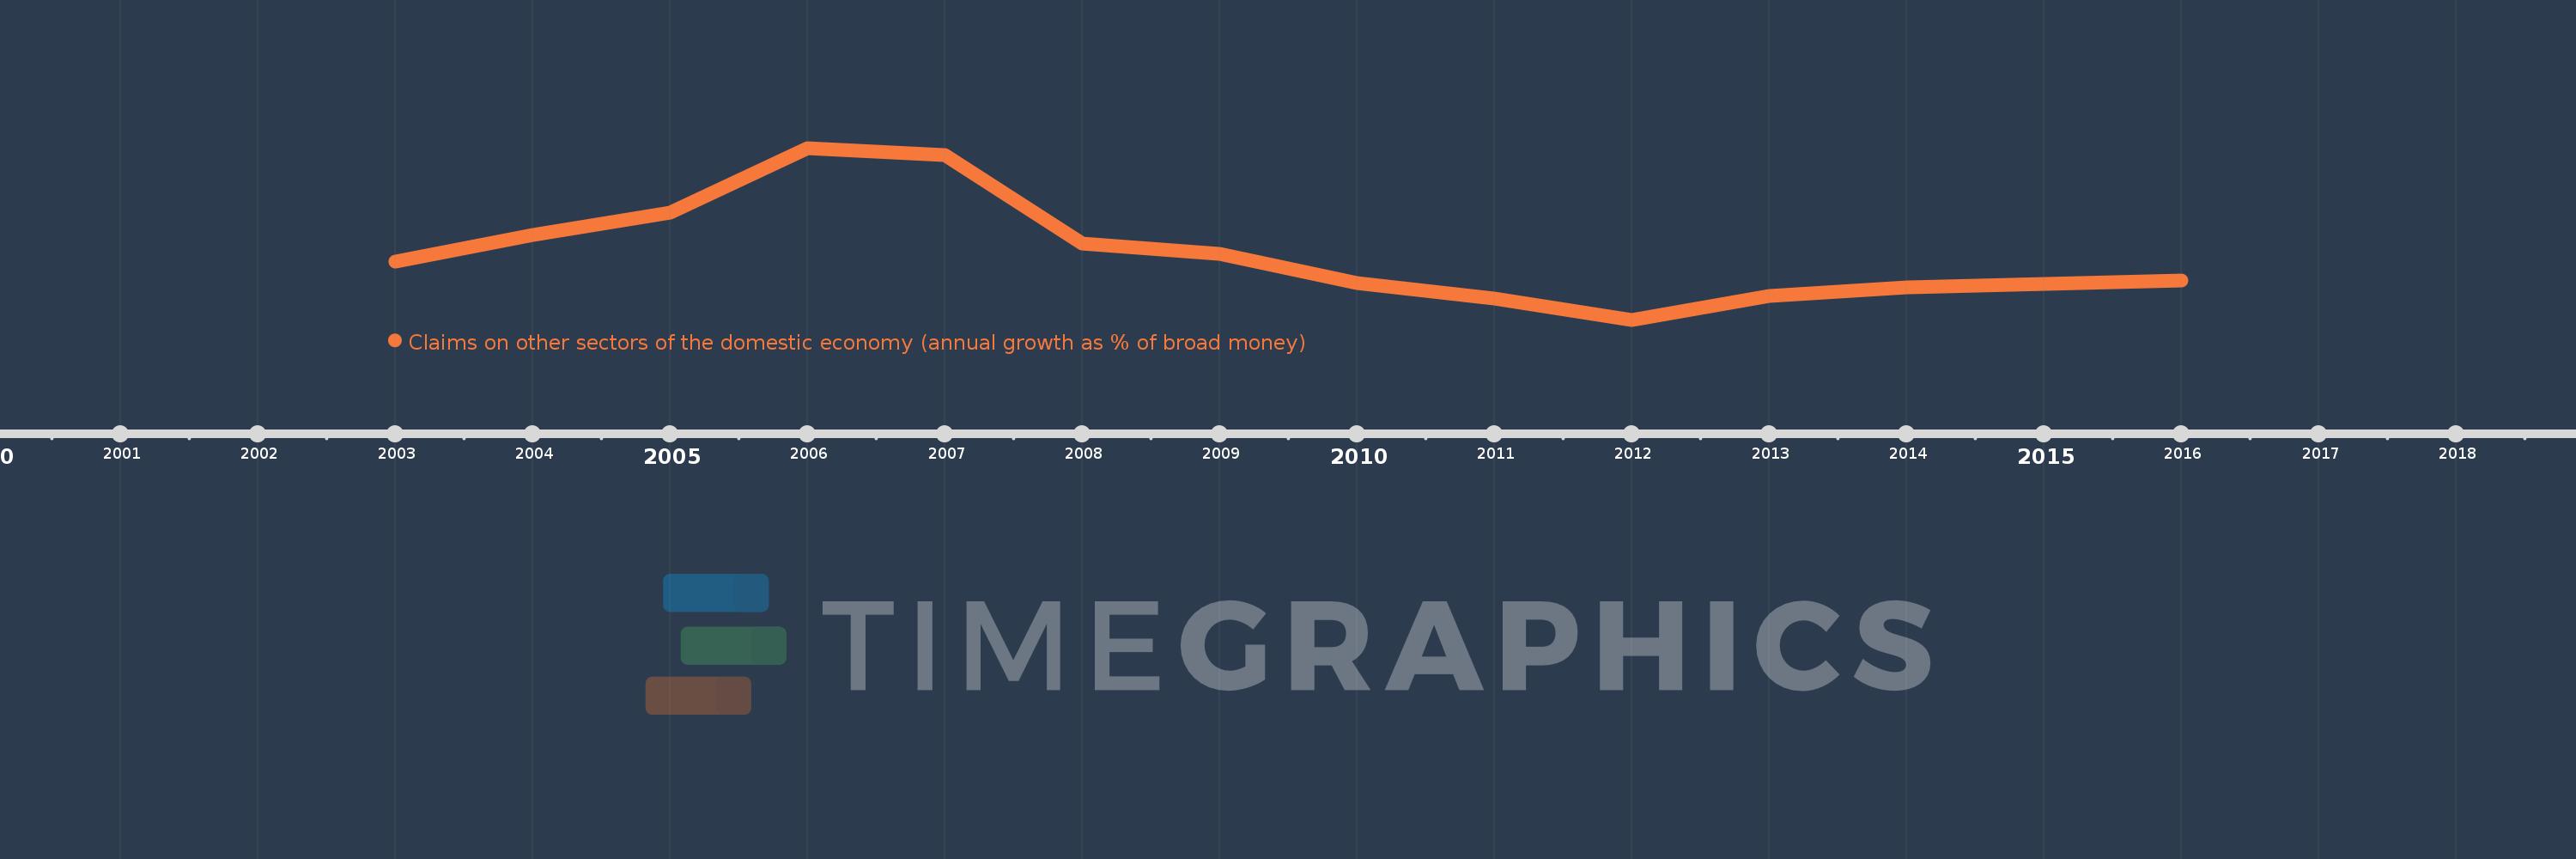
Questa scala temporale mostra un grafico dal 2003 anno al 2016 anno. Iceland. I dati fino ad 2002 anno non disponibili. Il numero di osservazioni attuali secondo i date: 14.
La fonte (nome):
Indicatori dello sviluppo mondiale
La fonte (organizzazione):
International Monetary Fund, International Financial Statistics and data files.
Categorie:
Financial Sector
sono stati aggiornati
23 apr 2017 anni
Indicatori delle variazioni dei valori per anni
In media:
32.943
Minima:
-58.107
1 gen 2012 anni
Massimo:
180.838
1 gen 2006 anni
Alla data di osservazione
Valore
Variazione assoluta
La variazione rispetto al valore precedente
1 gen 2003 anni
23.071
+23.071
0.0%
1 gen 2004 anni
59.465
+36.395
157.75%
1 gen 2005 anni
91.045
+31.579
53.11%
1 gen 2006 anni
180.838
+89.793
98.63%
1 gen 2007 anni
170.518
-10.32
-5.71%
1 gen 2008 anni
47.98
-122.538
-71.86%
1 gen 2009 anni
33.6
-14.38
-29.97%
1 gen 2010 anni
-6.833
-40.433
-120.34%
1 gen 2011 anni
-29.186
-22.353
327.14%
1 gen 2012 anni
-58.107
-28.922
99.1%
1 gen 2013 anni
-25.482
+32.625
-56.15%
1 gen 2014 anni
-13.606
+11.877
-46.61%
1 gen 2015 anni
-8.188
+5.418
-39.82%
1 gen 2016 anni
-3.912
+4.276
-52.23%
Classificazione dei paesi secondo i statistiche attuali per anni