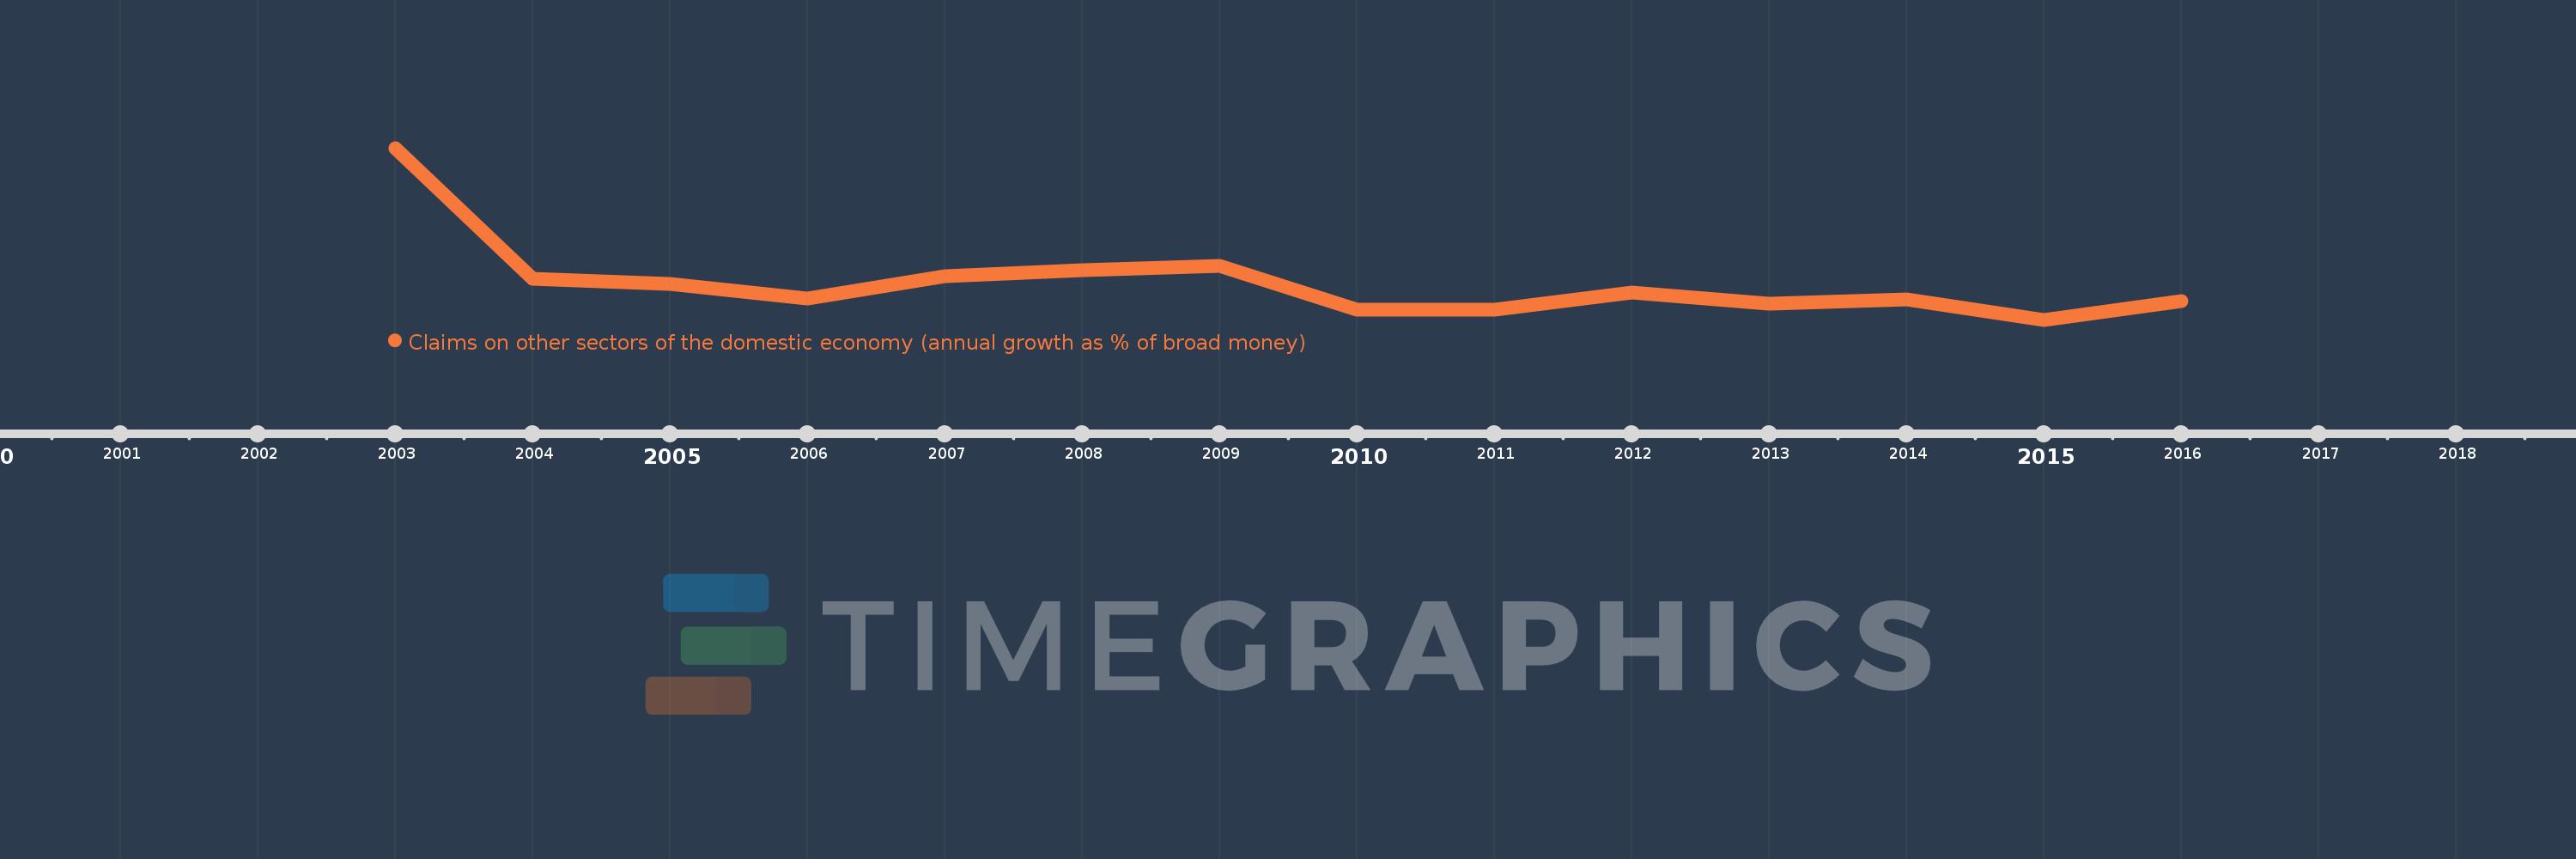
Questa scala temporale mostra un grafico dal 2003 anno al 2016 anno. Suriname. I dati fino ad 2002 anno non disponibili. Il numero di osservazioni attuali secondo i date: 14.
La fonte (nome):
Indicatori dello sviluppo mondiale
La fonte (organizzazione):
International Monetary Fund, International Financial Statistics and data files.
Categorie:
Financial Sector
sono stati aggiornati
23 apr 2017 anni
Indicatori delle variazioni dei valori per anni
In media:
13.365
Minima:
4.675
1 gen 2015 anni
Massimo:
44.988
1 gen 2003 anni
Alla data di osservazione
Valore
Variazione assoluta
La variazione rispetto al valore precedente
1 gen 2003 anni
44.988
+44.988
0.0%
1 gen 2004 anni
14.226
-30.763
-68.38%
1 gen 2005 anni
13.055
-1.17
-8.23%
1 gen 2006 anni
9.567
-3.488
-26.72%
1 gen 2007 anni
14.967
+5.4
56.44%
1 gen 2008 anni
16.369
+1.402
9.37%
1 gen 2009 anni
17.367
+0.998
6.09%
1 gen 2010 anni
6.96
-10.406
-59.92%
1 gen 2011 anni
6.974
+0.013
0.19%
1 gen 2012 anni
11.043
+4.069
58.36%
1 gen 2013 anni
8.503
-2.54
-23.0%
1 gen 2014 anni
9.414
+0.911
10.72%
1 gen 2015 anni
4.675
-4.739
-50.34%
1 gen 2016 anni
8.997
+4.322
92.45%
Classificazione dei paesi secondo i statistiche attuali per anni