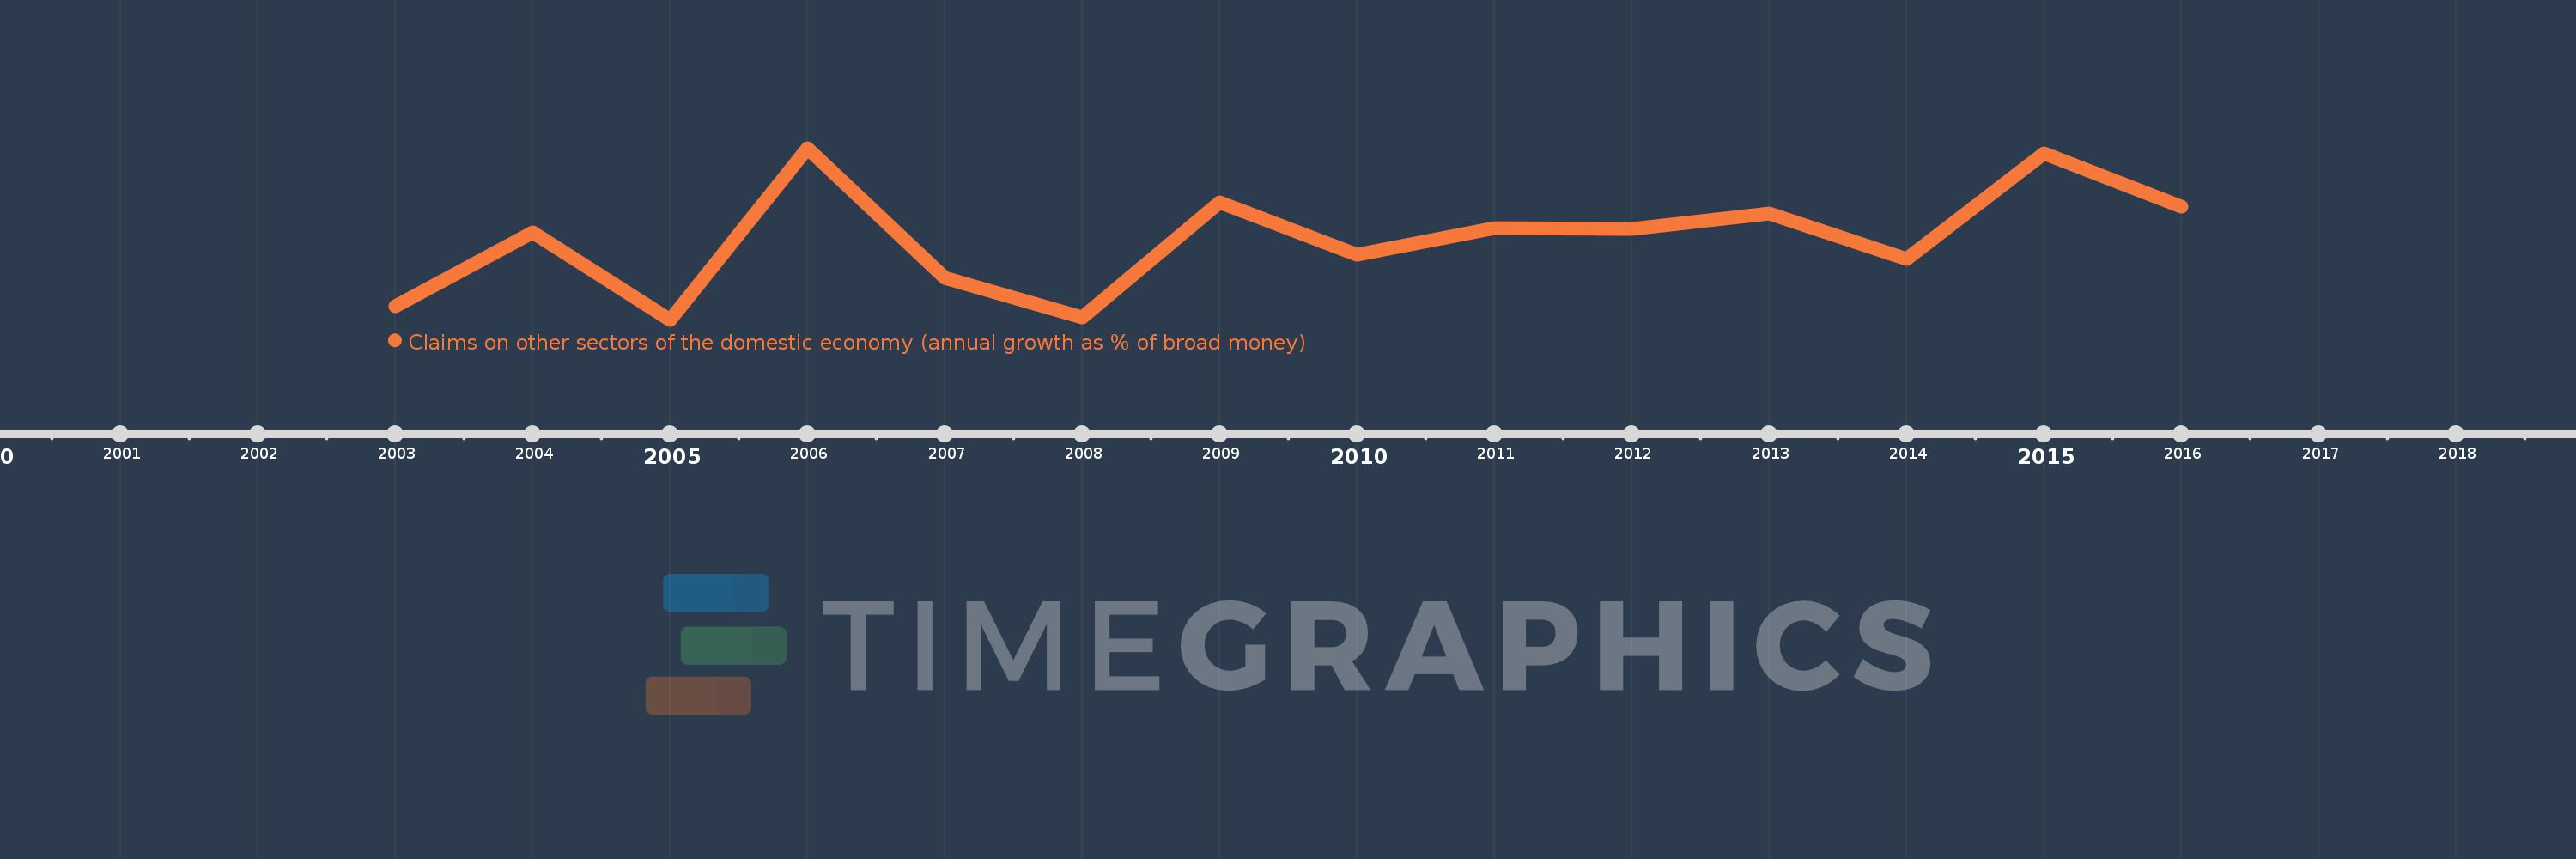
Questa scala temporale mostra un grafico dal 2003 anno al 2016 anno. Chad. I dati fino ad 2002 anno non disponibili. Il numero di osservazioni attuali secondo i date: 14.
La fonte (nome):
Indicatori dello sviluppo mondiale
La fonte (organizzazione):
International Monetary Fund, International Financial Statistics and data files.
Categorie:
Financial Sector
sono stati aggiornati
23 apr 2017 anni
Indicatori delle variazioni dei valori per anni
In media:
7.894
Minima:
-2.872
1 gen 2005 anni
Massimo:
20.082
1 gen 2006 anni
Alla data di osservazione
Valore
Variazione assoluta
La variazione rispetto al valore precedente
1 gen 2003 anni
-1.079
-1.079
0.0%
1 gen 2004 anni
8.823
+9.902
-917.5%
1 gen 2005 anni
-2.872
-11.695
-132.56%
1 gen 2006 anni
20.082
+22.954
-799.15%
1 gen 2007 anni
2.748
-17.334
-86.32%
1 gen 2008 anni
-2.506
-5.254
-191.2%
1 gen 2009 anni
12.809
+15.315
-611.12%
1 gen 2010 anni
5.766
-7.043
-54.98%
1 gen 2011 anni
9.33
+3.564
61.81%
1 gen 2012 anni
9.224
-0.106
-1.14%
1 gen 2013 anni
11.351
+2.127
23.06%
1 gen 2014 anni
5.254
-6.097
-53.71%
1 gen 2015 anni
19.382
+14.128
268.9%
1 gen 2016 anni
12.2
-7.183
-37.06%
Classificazione dei paesi secondo i statistiche attuali per anni