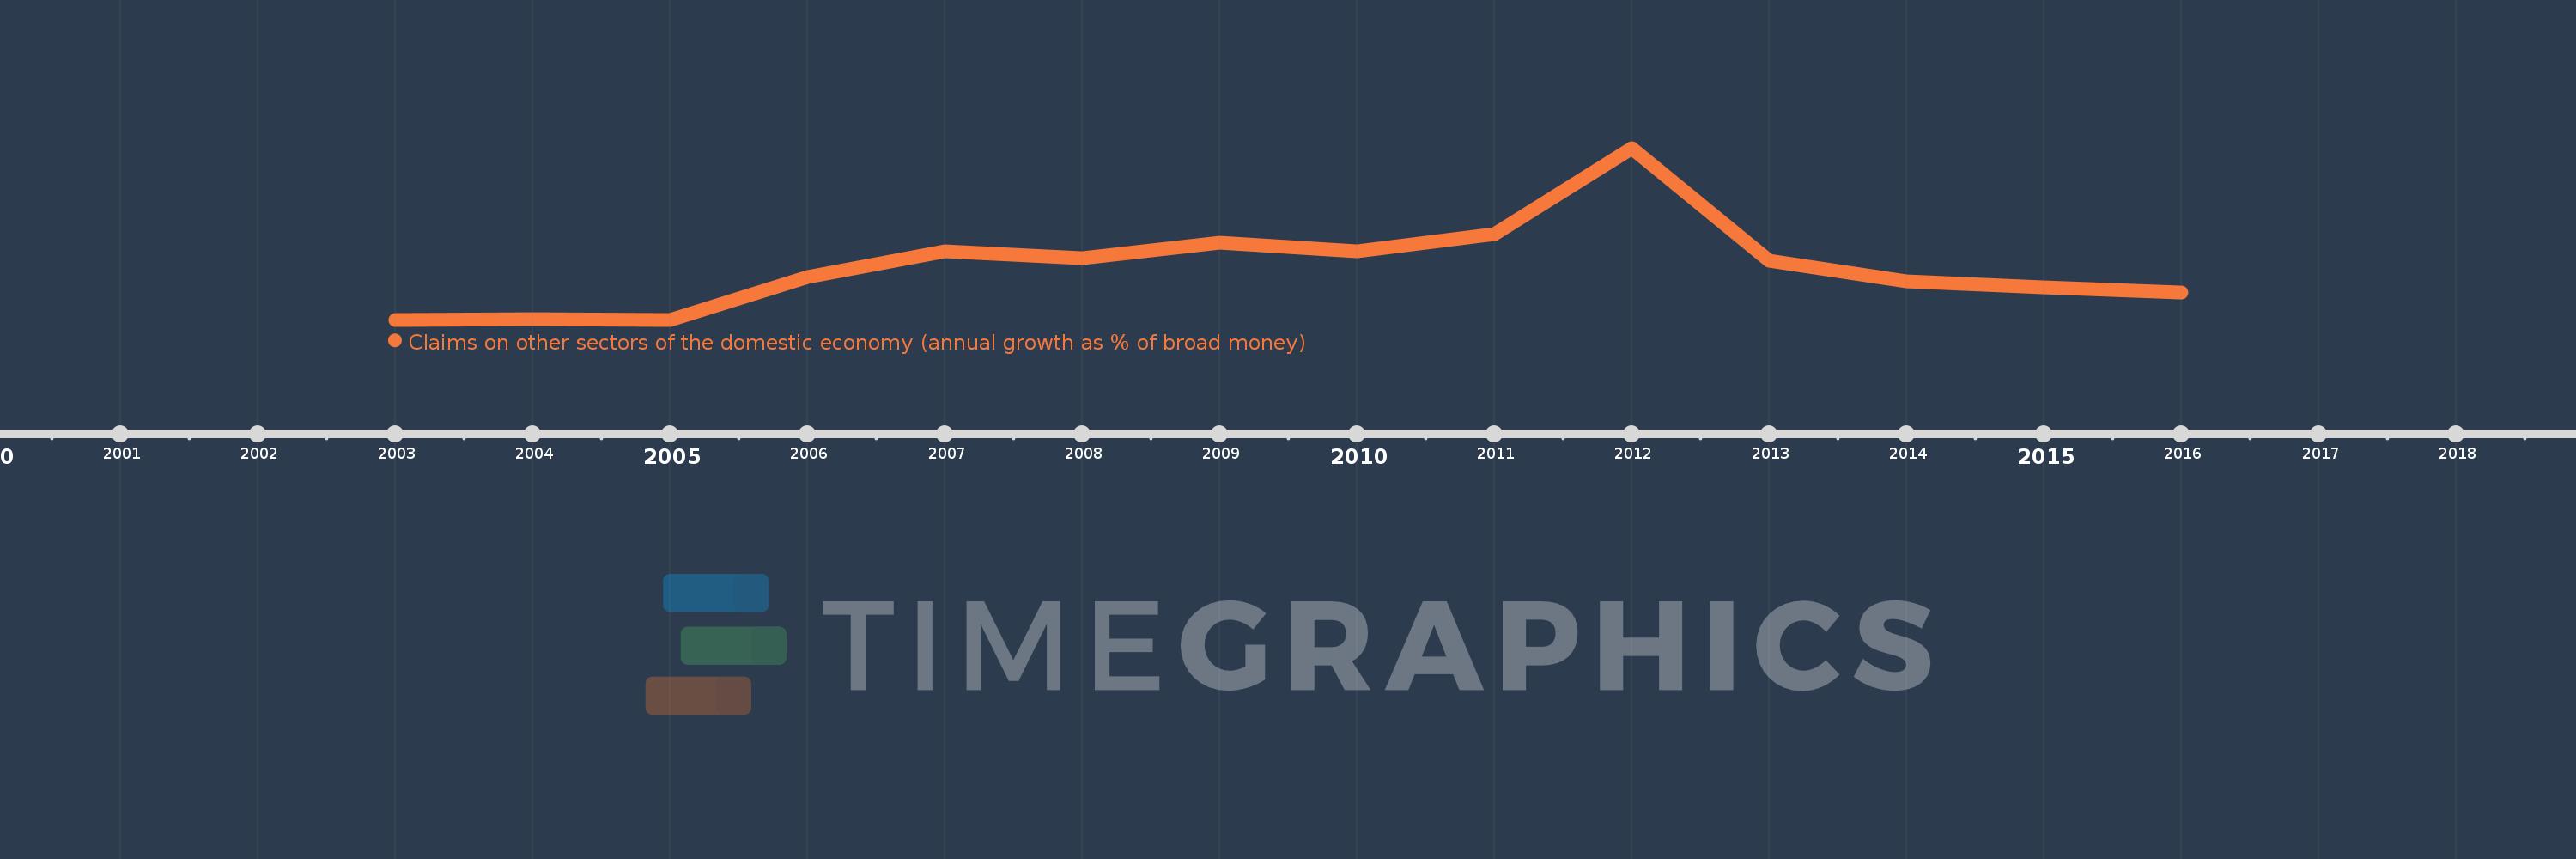
Questa scala temporale mostra un grafico dal 2003 anno al 2016 anno. Belarus. I dati fino ad 2002 anno non disponibili. Il numero di osservazioni attuali secondo i date: 14.
La fonte (nome):
Indicatori dello sviluppo mondiale
La fonte (organizzazione):
International Monetary Fund, International Financial Statistics and data files.
Categorie:
Financial Sector
sono stati aggiornati
23 apr 2017 anni
Indicatori delle variazioni dei valori per anni
In media:
50.87
Minima:
5.985
1 gen 2003 anni
Massimo:
153.026
1 gen 2012 anni
Alla data di osservazione
Valore
Variazione assoluta
La variazione rispetto al valore precedente
1 gen 2003 anni
5.985
+5.985
0.0%
1 gen 2004 anni
6.492
+0.507
8.47%
1 gen 2005 anni
6.051
-0.441
-6.79%
1 gen 2006 anni
42.332
+36.281
599.55%
1 gen 2007 anni
64.89
+22.558
53.29%
1 gen 2008 anni
58.699
-6.191
-9.54%
1 gen 2009 anni
71.822
+13.123
22.36%
1 gen 2010 anni
64.882
-6.94
-9.66%
1 gen 2011 anni
79.175
+14.293
22.03%
1 gen 2012 anni
153.026
+73.851
93.28%
1 gen 2013 anni
56.732
-96.294
-62.93%
1 gen 2014 anni
39.15
-17.582
-30.99%
1 gen 2015 anni
33.555
-5.595
-14.29%
1 gen 2016 anni
29.396
-4.159
-12.39%
Classificazione dei paesi secondo i statistiche attuali per anni