Questa scala temporale mostra un grafico dal 2003 anno al 2016 anno. Qatar. I dati fino ad 2002 anno non disponibili. Il numero di osservazioni attuali secondo i date: 14.
La fonte (nome):
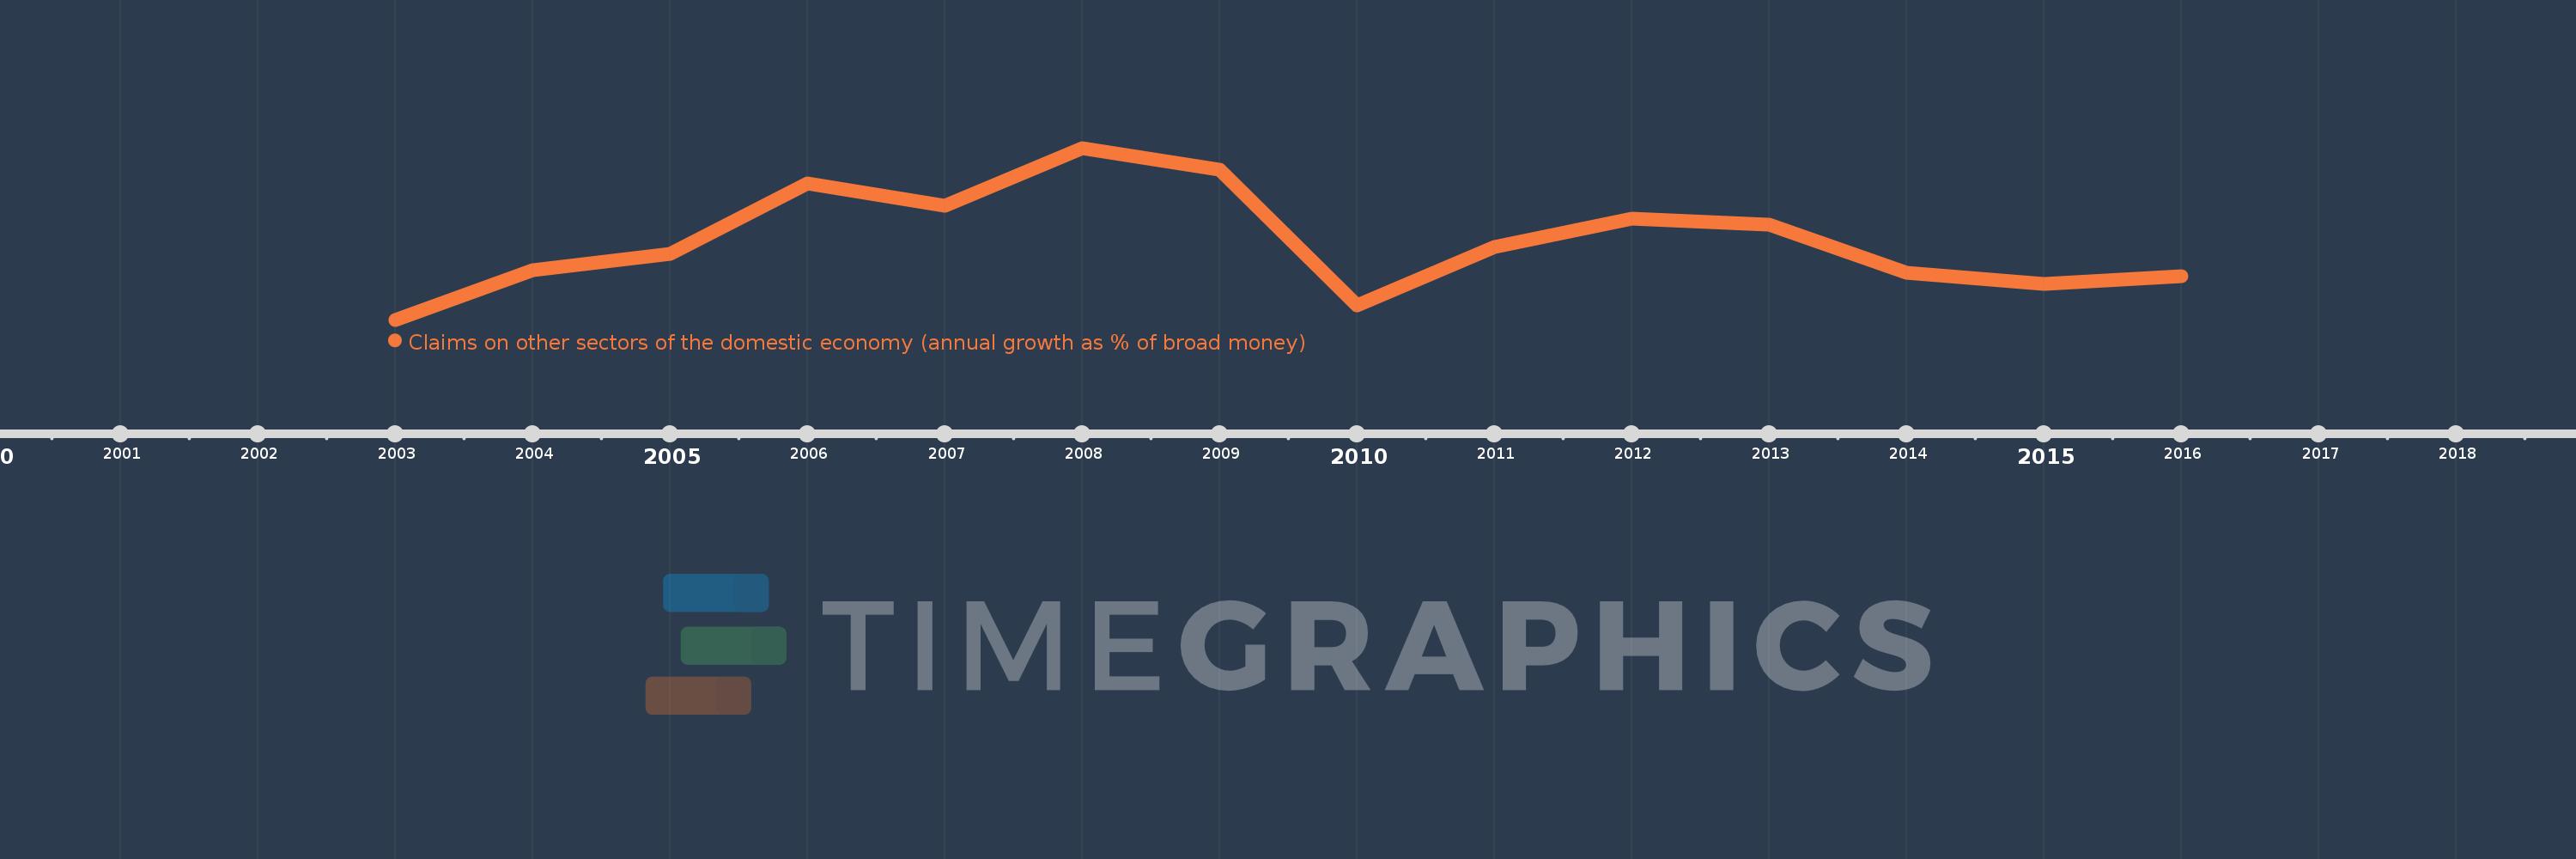
Indicatori dello sviluppo mondiale
La fonte (organizzazione):
International Monetary Fund, International Financial Statistics and data files.
Categorie:
Financial Sector
sono stati aggiornati
23 apr 2017 anni
Indicatori delle variazioni dei valori per anni
In media:
23.384
Minima:
-1.654
1 gen 2003 anni
Massimo:
53.225
1 gen 2008 anni
Alla data di osservazione
Valore
Variazione assoluta
La variazione rispetto al valore precedente
1 gen 2003 anni
-1.654
-1.654
0.0%
1 gen 2004 anni
14.241
+15.895
-961.25%
1 gen 2005 anni
19.388
+5.147
36.14%
1 gen 2006 anni
41.956
+22.568
116.4%
1 gen 2007 anni
34.668
-7.288
-17.37%
1 gen 2008 anni
53.225
+18.557
53.53%
1 gen 2009 anni
46.307
-6.917
-13.0%
1 gen 2010 anni
2.9
-43.407
-93.74%
1 gen 2011 anni
21.587
+18.687
644.38%
1 gen 2012 anni
30.525
+8.938
41.4%
1 gen 2013 anni
28.626
-1.899
-6.22%
1 gen 2014 anni
13.469
-15.158
-52.95%
1 gen 2015 anni
9.832
-3.637
-27.0%
1 gen 2016 anni
12.305
+2.473
25.16%
Classificazione dei paesi secondo i statistiche attuali per anni