Questa scala temporale mostra un grafico dal 2003 anno al 2016 anno. Papua New Guinea. I dati fino ad 2002 anno non disponibili. Il numero di osservazioni attuali secondo i date: 14.
La fonte (nome):
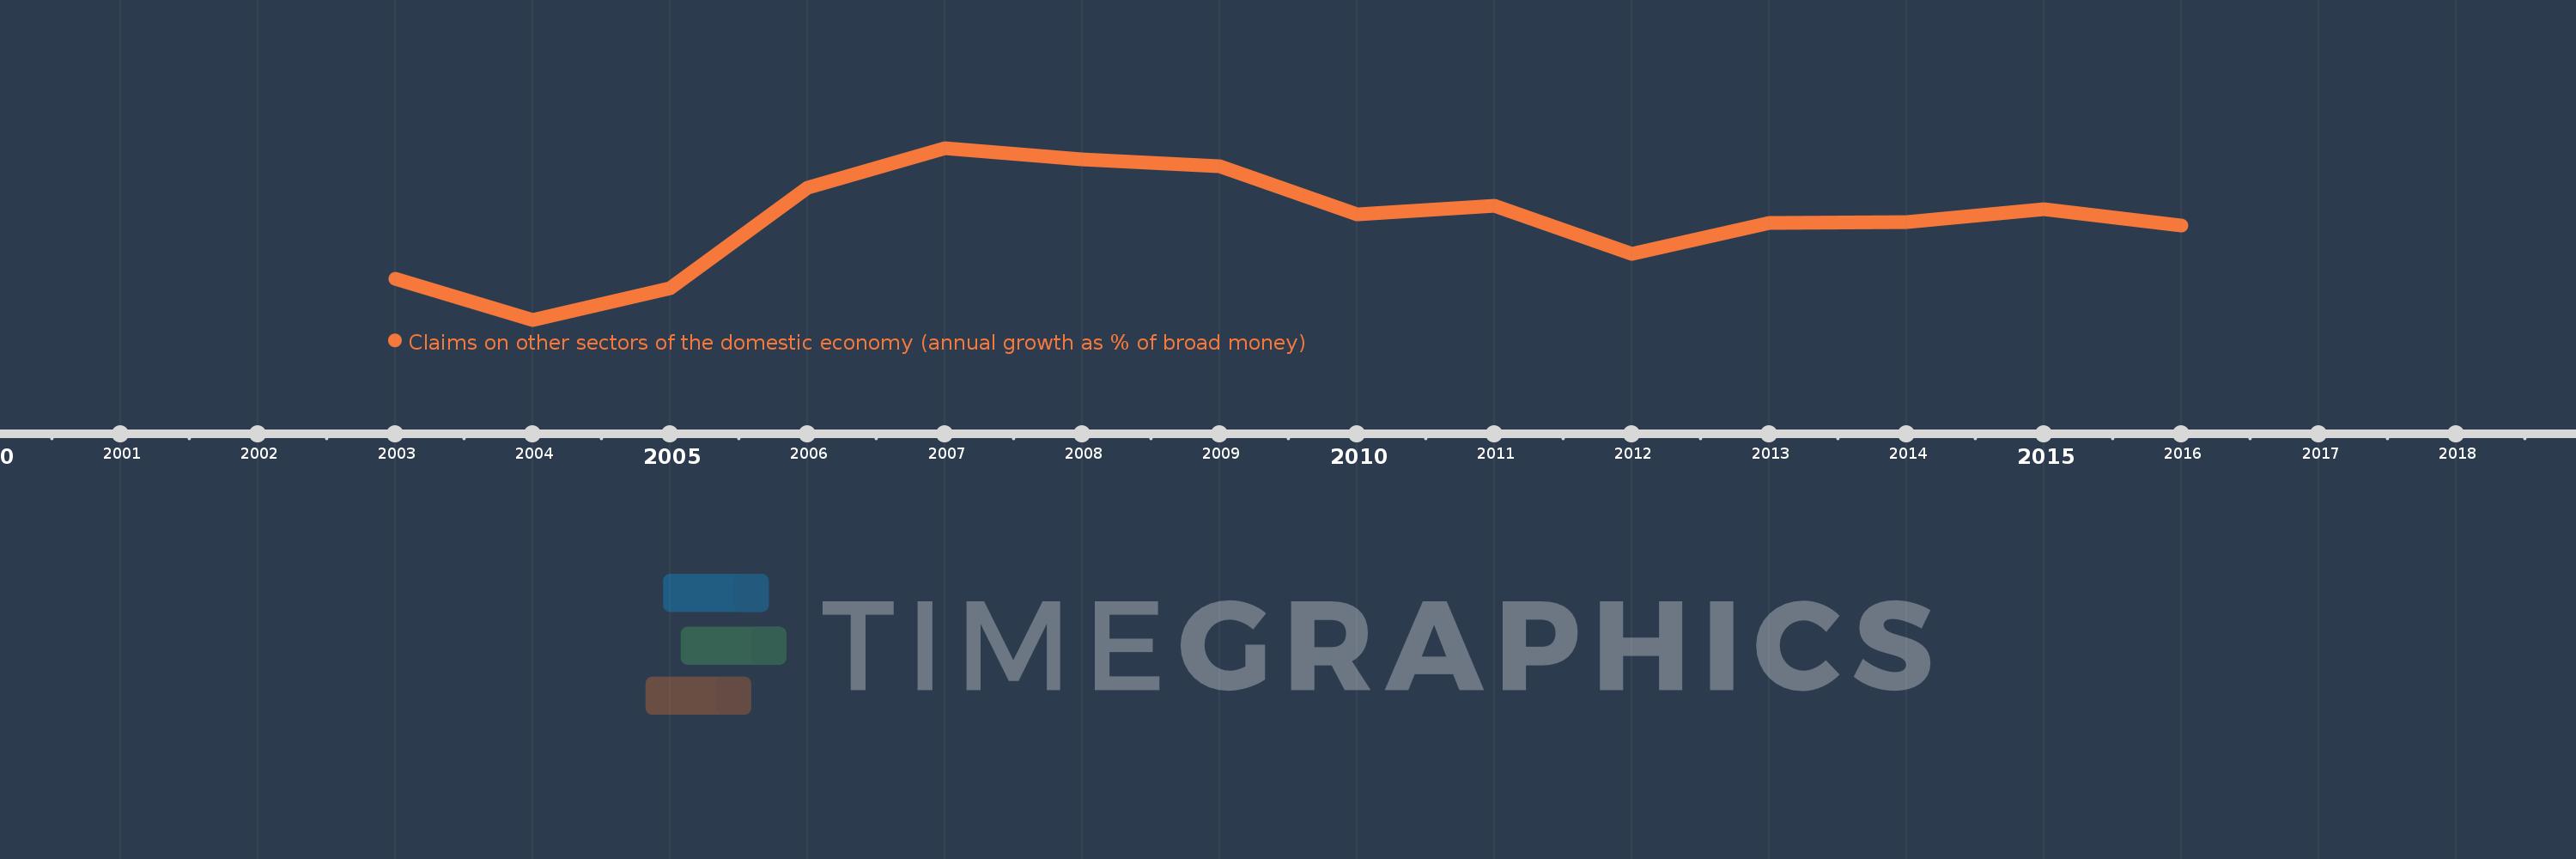
Indicatori dello sviluppo mondiale
La fonte (organizzazione):
International Monetary Fund, International Financial Statistics and data files.
Categorie:
Financial Sector
sono stati aggiornati
23 apr 2017 anni
Indicatori delle variazioni dei valori per anni
In media:
7.547
Minima:
-3.324
1 gen 2004 anni
Massimo:
15.691
1 gen 2007 anni
Alla data di osservazione
Valore
Variazione assoluta
La variazione rispetto al valore precedente
1 gen 2003 anni
1.212
+1.212
0.0%
1 gen 2004 anni
-3.324
-4.536
-374.15%
1 gen 2005 anni
0.18
+3.504
-105.42%
1 gen 2006 anni
11.295
+11.115
6.17 Mille.%
1 gen 2007 anni
15.691
+4.396
38.92%
1 gen 2008 anni
14.386
-1.304
-8.31%
1 gen 2009 anni
13.683
-0.703
-4.89%
1 gen 2010 anni
8.362
-5.322
-38.89%
1 gen 2011 anni
9.334
+0.973
11.63%
1 gen 2012 anni
3.93
-5.405
-57.9%
1 gen 2013 anni
7.366
+3.437
87.45%
1 gen 2014 anni
7.504
+0.137
1.86%
1 gen 2015 anni
8.934
+1.43
19.06%
1 gen 2016 anni
7.109
-1.824
-20.42%
Classificazione dei paesi secondo i statistiche attuali per anni