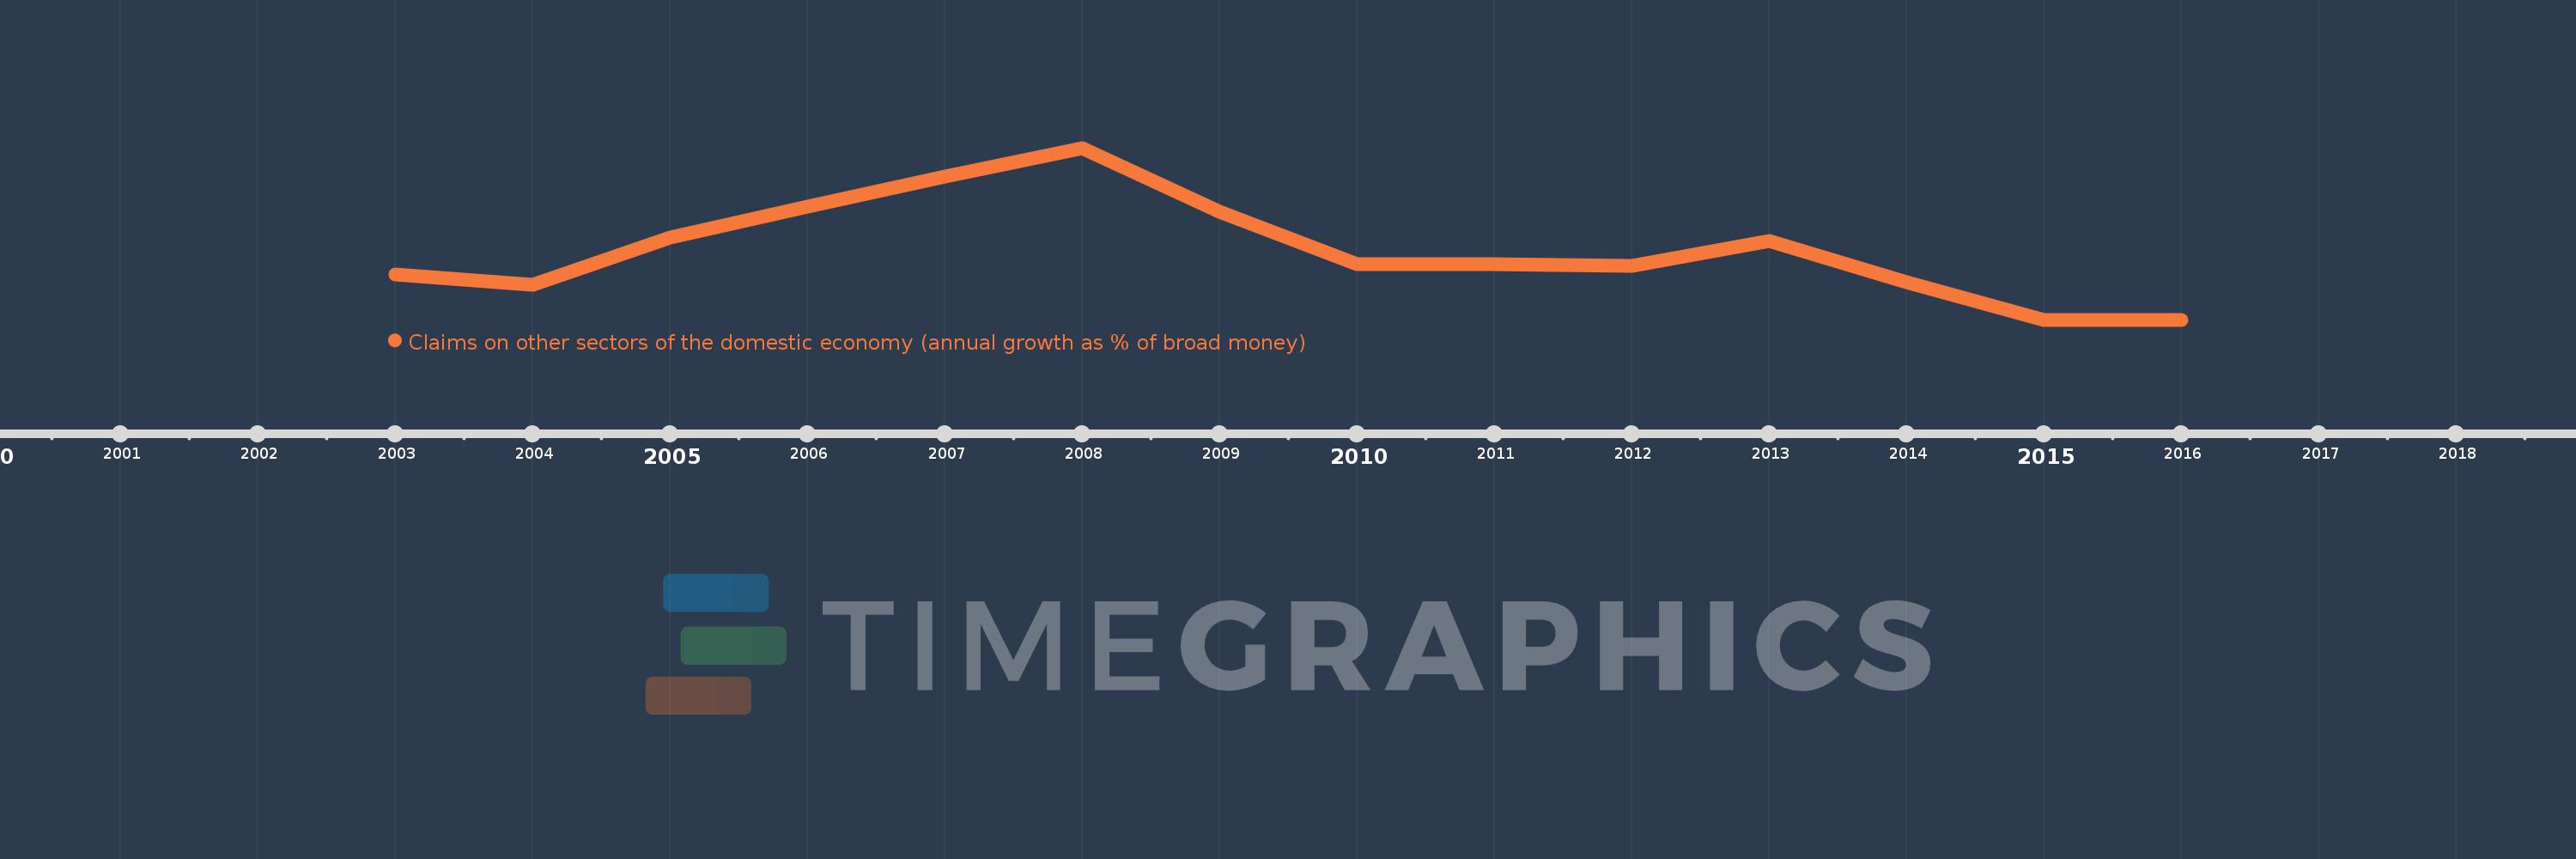
Questa scala temporale mostra un grafico dal 2003 anno al 2016 anno. St. Lucia. I dati fino ad 2002 anno non disponibili. Il numero di osservazioni attuali secondo i date: 14.
La fonte (nome):
Indicatori dello sviluppo mondiale
La fonte (organizzazione):
International Monetary Fund, International Financial Statistics and data files.
Categorie:
Financial Sector
sono stati aggiornati
23 apr 2017 anni
Indicatori delle variazioni dei valori per anni
In media:
6.264
Minima:
-8.815
1 gen 2016 anni
Massimo:
28.191
1 gen 2008 anni
Alla data di osservazione
Valore
Variazione assoluta
La variazione rispetto al valore precedente
1 gen 2003 anni
0.923
+0.923
0.0%
1 gen 2004 anni
-1.29
-2.213
-239.81%
1 gen 2005 anni
8.821
+10.111
-783.86%
1 gen 2006 anni
15.549
+6.728
76.27%
1 gen 2007 anni
22.003
+6.454
41.51%
1 gen 2008 anni
28.191
+6.188
28.12%
1 gen 2009 anni
14.368
-13.824
-49.04%
1 gen 2010 anni
3.194
-11.173
-77.77%
1 gen 2011 anni
3.168
-0.026
-0.8%
1 gen 2012 anni
2.855
-0.313
-9.89%
1 gen 2013 anni
8.209
+5.354
187.5%
1 gen 2014 anni
-0.687
-8.896
-108.37%
1 gen 2015 anni
-8.798
-8.11
1.18 Mille.%
1 gen 2016 anni
-8.815
-0.018
0.2%
Classificazione dei paesi secondo i statistiche attuali per anni