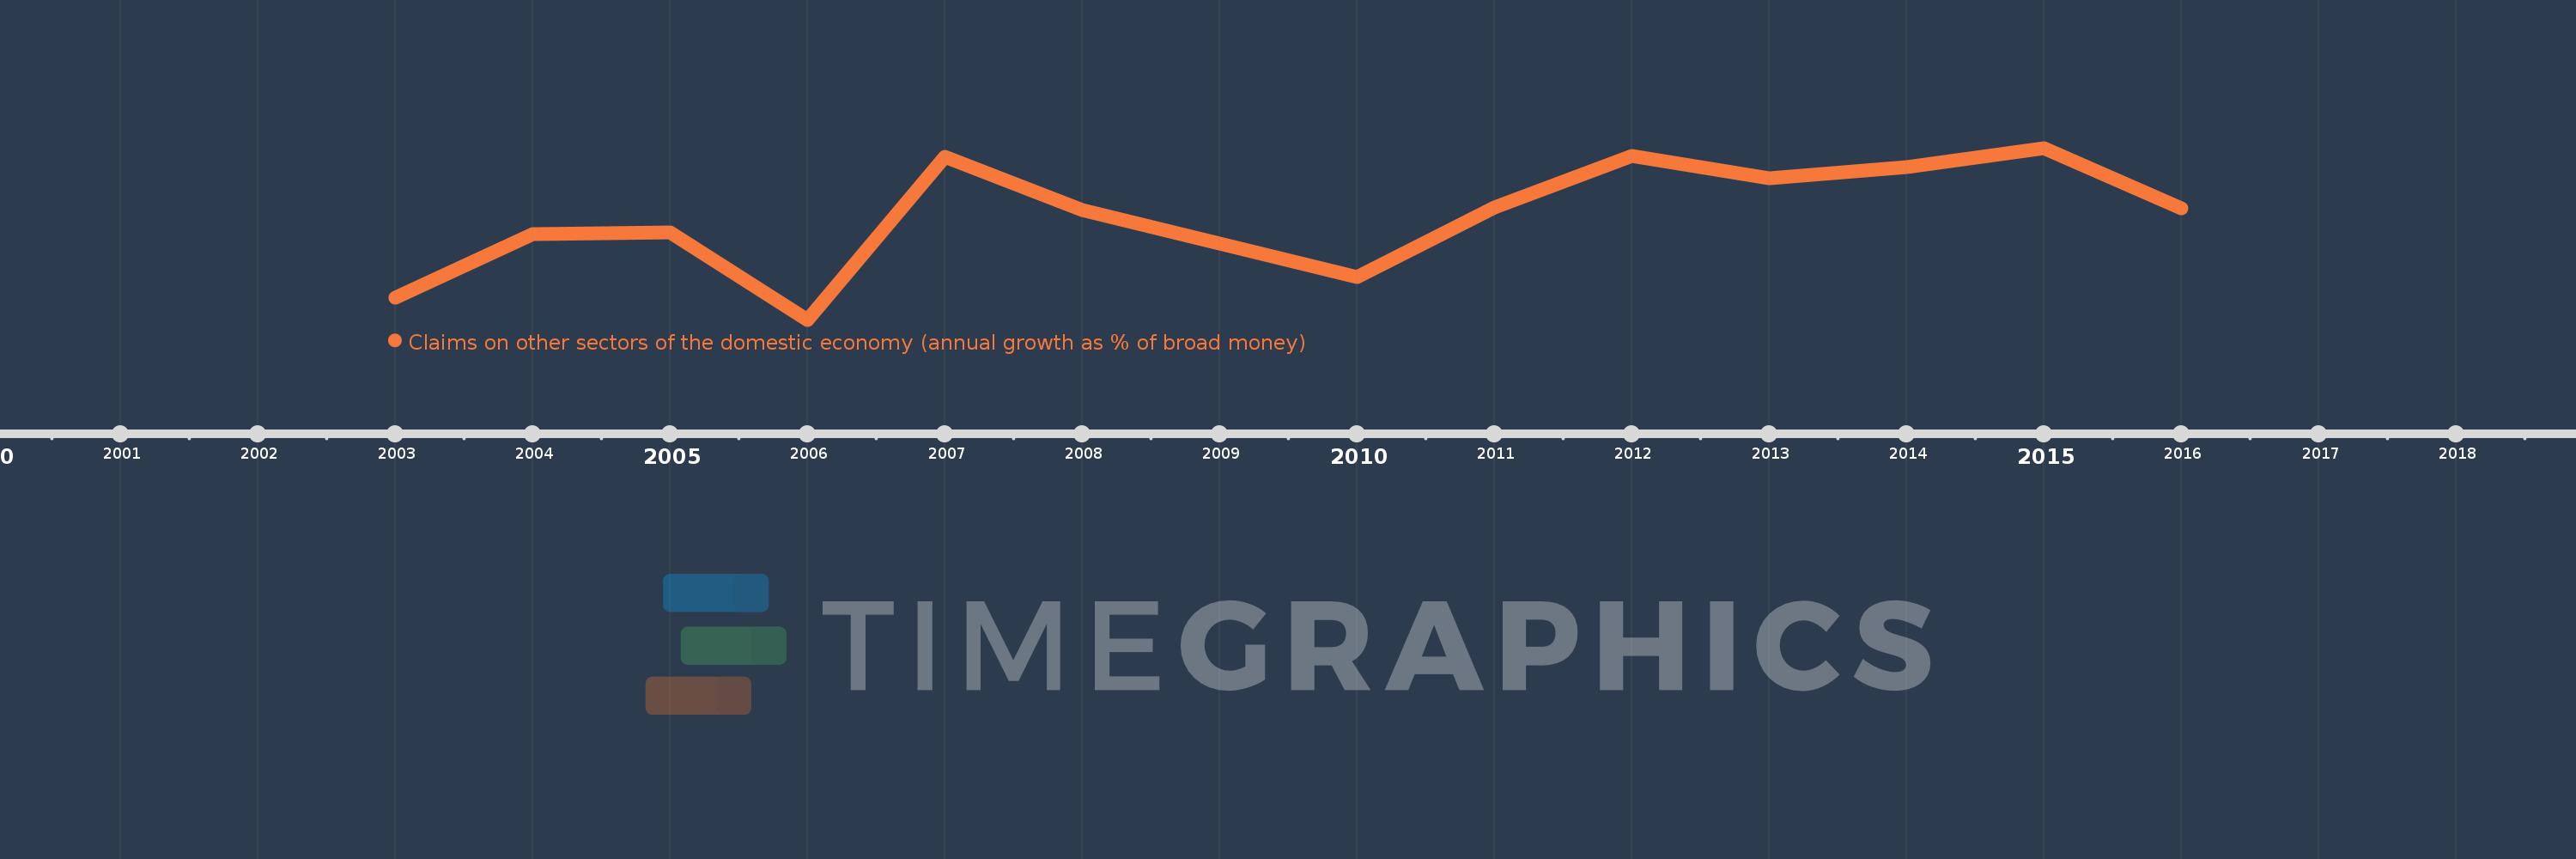
Questa scala temporale mostra un grafico dal 2003 anno al 2016 anno. Philippines. I dati fino ad 2002 anno non disponibili. Il numero di osservazioni attuali secondo i date: 14.
La fonte (nome):
Indicatori dello sviluppo mondiale
La fonte (organizzazione):
International Monetary Fund, International Financial Statistics and data files.
Categorie:
Financial Sector
sono stati aggiornati
23 apr 2017 anni
Indicatori delle variazioni dei valori per anni
In media:
6.994
Minima:
1.061
1 gen 2006 anni
Massimo:
10.969
1 gen 2015 anni
Alla data di osservazione
Valore
Variazione assoluta
La variazione rispetto al valore precedente
1 gen 2003 anni
2.317
+2.317
0.0%
1 gen 2004 anni
6.011
+3.694
159.45%
1 gen 2005 anni
6.112
+0.101
1.68%
1 gen 2006 anni
1.061
-5.052
-82.65%
1 gen 2007 anni
10.448
+9.387
885.15%
1 gen 2008 anni
7.365
-3.083
-29.51%
1 gen 2009 anni
5.438
-1.927
-26.17%
1 gen 2010 anni
3.545
-1.893
-34.8%
1 gen 2011 anni
7.542
+3.996
112.72%
1 gen 2012 anni
10.504
+2.962
39.28%
1 gen 2013 anni
9.236
-1.268
-12.07%
1 gen 2014 anni
9.881
+0.645
6.98%
1 gen 2015 anni
10.969
+1.089
11.02%
1 gen 2016 anni
7.487
-3.483
-31.75%
Classificazione dei paesi secondo i statistiche attuali per anni