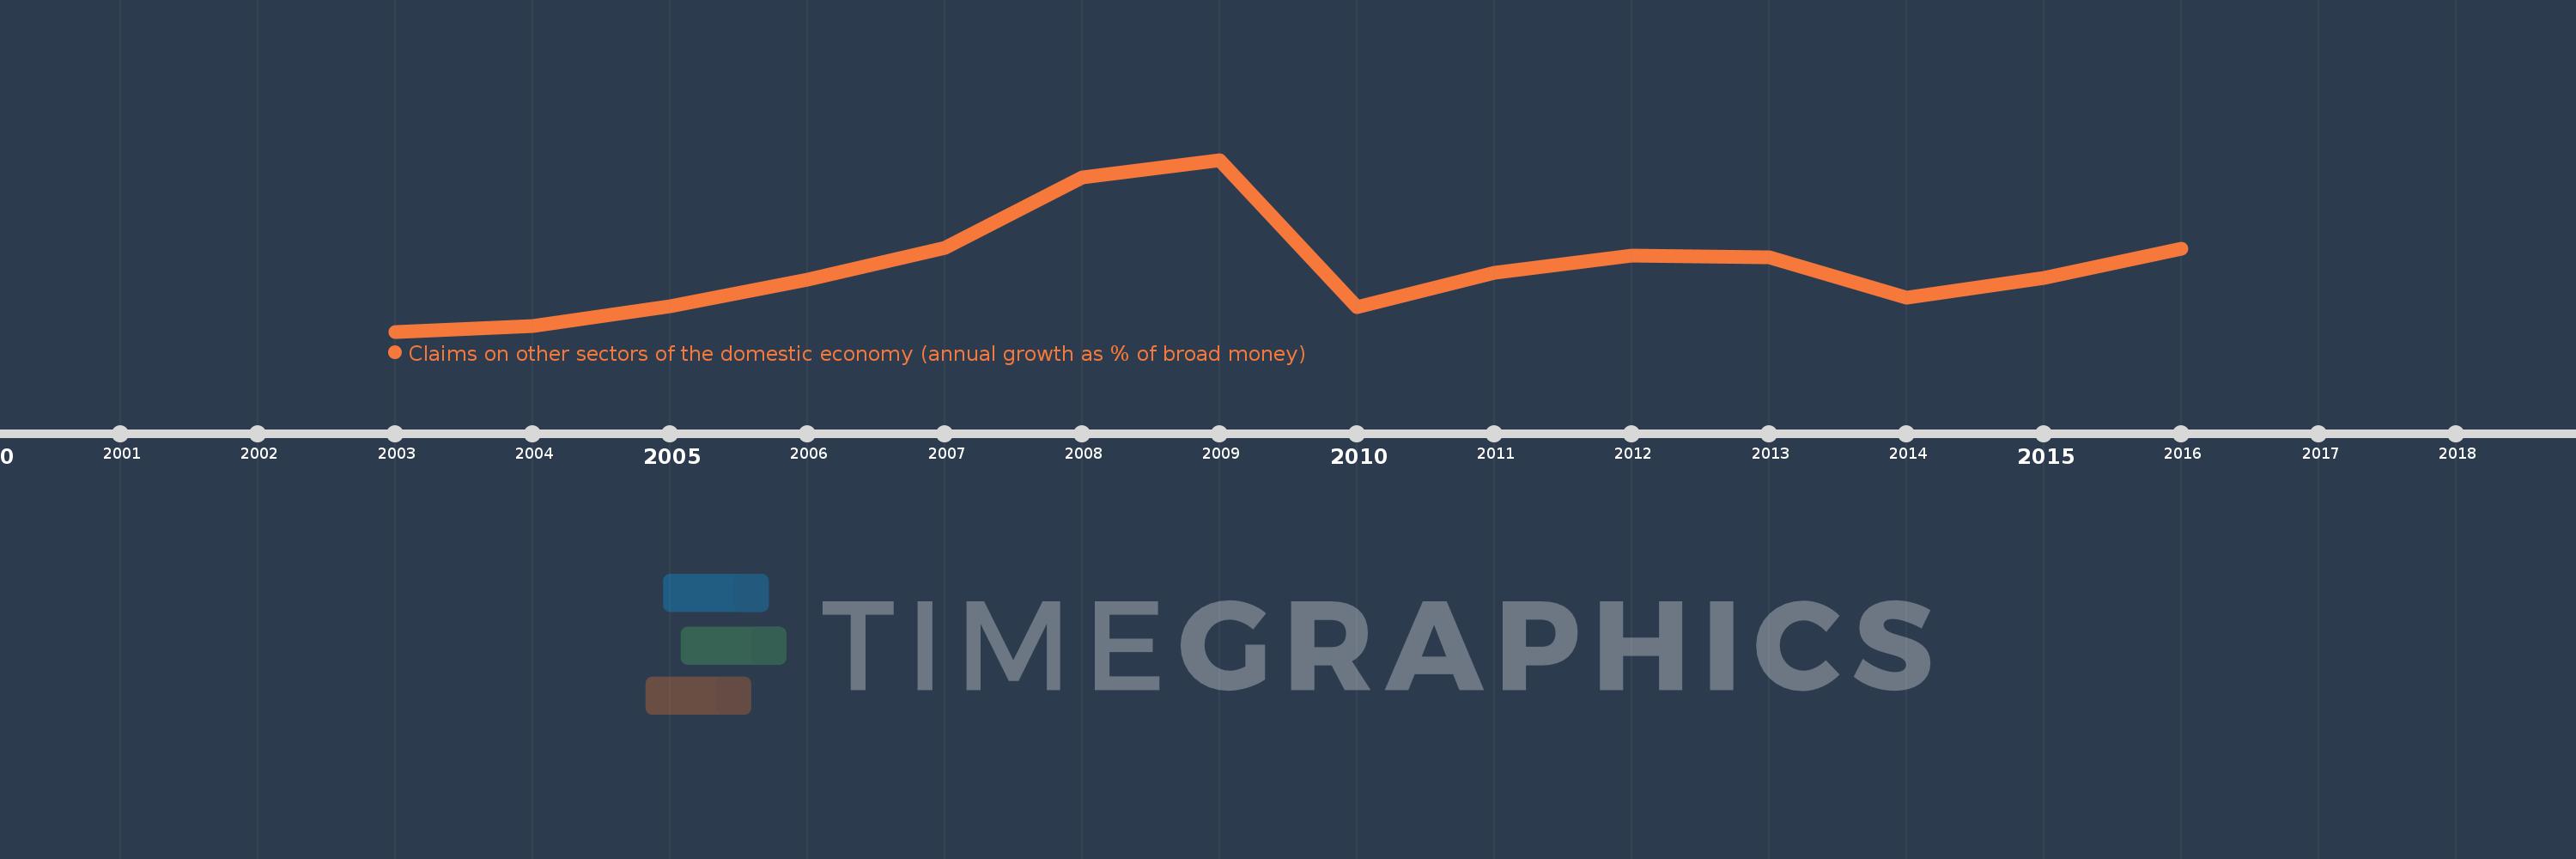
Questa scala temporale mostra un grafico dal 2003 anno al 2016 anno. Oman. I dati fino ad 2002 anno non disponibili. Il numero di osservazioni attuali secondo i date: 14.
La fonte (nome):
Indicatori dello sviluppo mondiale
La fonte (organizzazione):
International Monetary Fund, International Financial Statistics and data files.
Categorie:
Financial Sector
sono stati aggiornati
23 apr 2017 anni
Indicatori delle variazioni dei valori per anni
In media:
17.448
Minima:
1.097
1 gen 2003 anni
Massimo:
44.976
1 gen 2009 anni
Alla data di osservazione
Valore
Variazione assoluta
La variazione rispetto al valore precedente
1 gen 2003 anni
1.097
+1.097
0.0%
1 gen 2004 anni
2.503
+1.406
128.12%
1 gen 2005 anni
7.536
+5.033
201.11%
1 gen 2006 anni
14.302
+6.766
89.78%
1 gen 2007 anni
22.44
+8.138
56.9%
1 gen 2008 anni
40.53
+18.09
80.62%
1 gen 2009 anni
44.976
+4.446
10.97%
1 gen 2010 anni
7.327
-37.649
-83.71%
1 gen 2011 anni
16.051
+8.724
119.07%
1 gen 2012 anni
20.428
+4.377
27.27%
1 gen 2013 anni
20.014
-0.414
-2.03%
1 gen 2014 anni
9.813
-10.202
-50.97%
1 gen 2015 anni
14.909
+5.096
51.93%
1 gen 2016 anni
22.353
+7.444
49.93%
Classificazione dei paesi secondo i statistiche attuali per anni