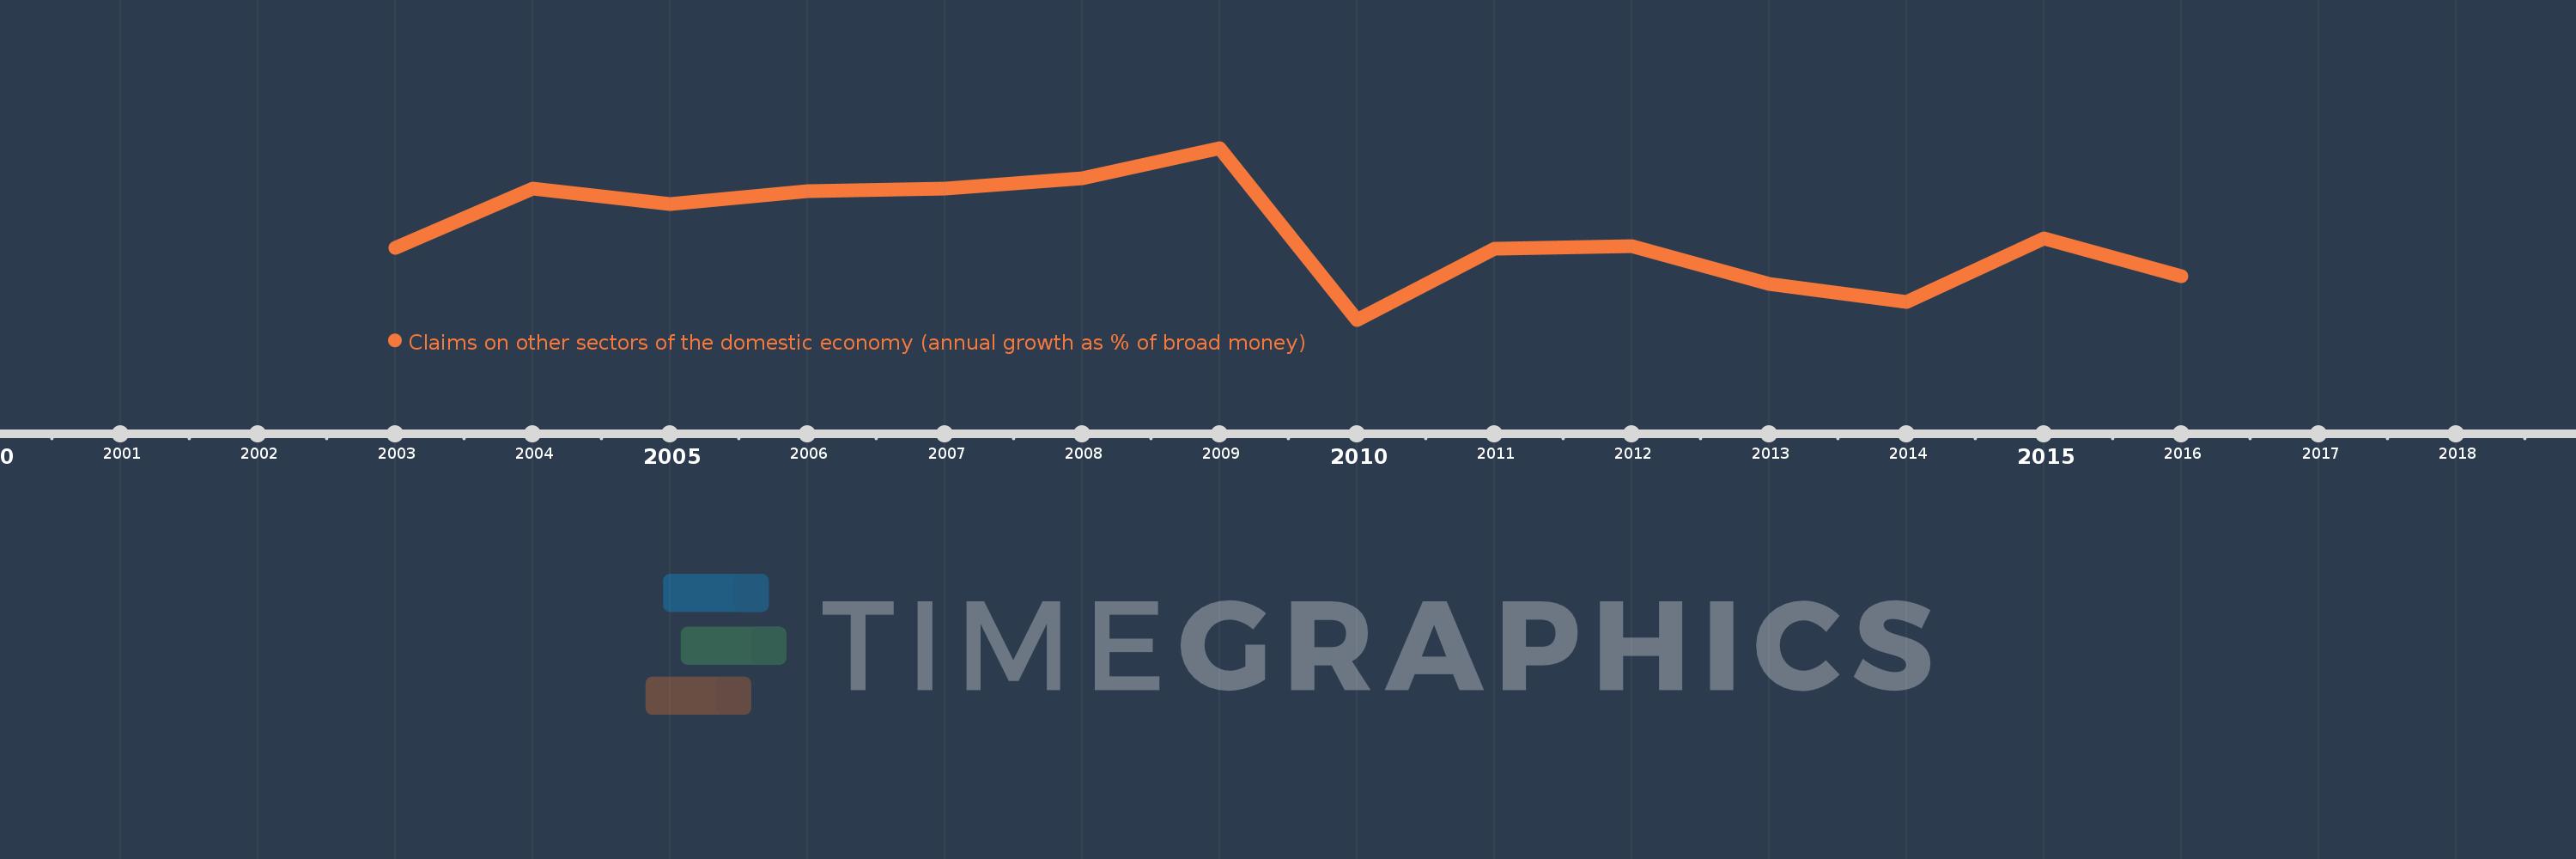
Questa scala temporale mostra un grafico dal 2003 anno al 2016 anno. Denmark. I dati fino ad 2002 anno non disponibili. Il numero di osservazioni attuali secondo i date: 14.
La fonte (nome):
Indicatori dello sviluppo mondiale
La fonte (organizzazione):
International Monetary Fund, International Financial Statistics and data files.
Categorie:
Financial Sector
sono stati aggiornati
23 apr 2017 anni
Indicatori delle variazioni dei valori per anni
In media:
22.387
Minima:
-28.024
1 gen 2010 anni
Massimo:
71.747
1 gen 2009 anni
Alla data di osservazione
Valore
Variazione assoluta
La variazione rispetto al valore precedente
1 gen 2003 anni
13.909
+13.909
0.0%
1 gen 2004 anni
47.914
+34.005
244.49%
1 gen 2005 anni
39.252
-8.662
-18.08%
1 gen 2006 anni
46.418
+7.166
18.26%
1 gen 2007 anni
48.243
+1.825
3.93%
1 gen 2008 anni
54.355
+6.112
12.67%
1 gen 2009 anni
71.747
+17.392
32.0%
1 gen 2010 anni
-28.024
-99.771
-139.06%
1 gen 2011 anni
13.197
+41.221
-147.09%
1 gen 2012 anni
14.539
+1.342
10.17%
1 gen 2013 anni
-7.076
-21.615
-148.67%
1 gen 2014 anni
-17.62
-10.545
149.03%
1 gen 2015 anni
19.172
+36.792
-208.81%
1 gen 2016 anni
-2.607
-21.779
-113.6%
Classificazione dei paesi secondo i statistiche attuali per anni