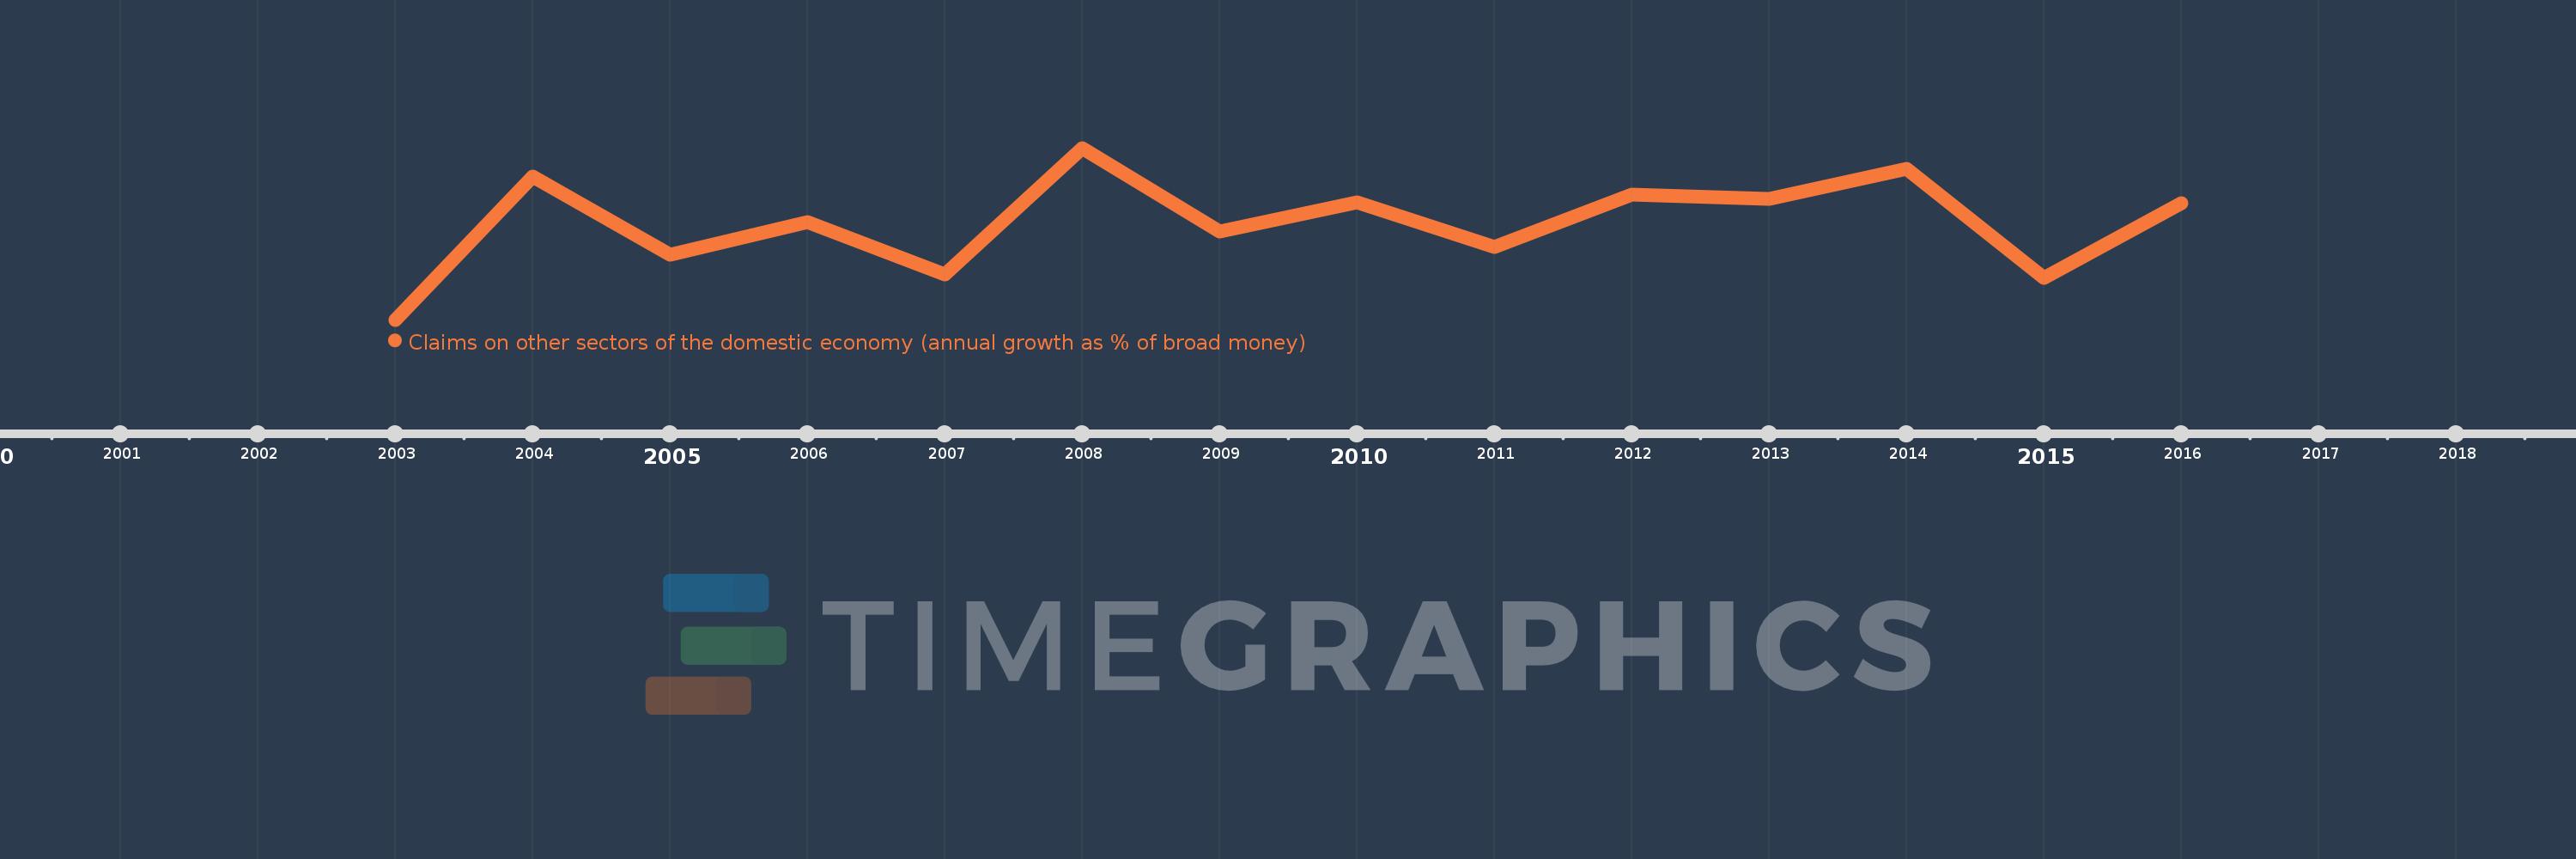
Questa scala temporale mostra un grafico dal 2003 anno al 2016 anno. Togo. I dati fino ad 2002 anno non disponibili. Il numero di osservazioni attuali secondo i date: 14.
La fonte (nome):
Indicatori dello sviluppo mondiale
La fonte (organizzazione):
International Monetary Fund, International Financial Statistics and data files.
Categorie:
Financial Sector
sono stati aggiornati
23 apr 2017 anni
Indicatori delle variazioni dei valori per anni
In media:
10.108
Minima:
-5.201
1 gen 2003 anni
Massimo:
21.936
1 gen 2008 anni
Alla data di osservazione
Valore
Variazione assoluta
La variazione rispetto al valore precedente
1 gen 2003 anni
-5.201
-5.201
0.0%
1 gen 2004 anni
17.45
+22.651
-435.52%
1 gen 2005 anni
5.017
-12.433
-71.25%
1 gen 2006 anni
10.211
+5.194
103.53%
1 gen 2007 anni
2.006
-8.205
-80.36%
1 gen 2008 anni
21.936
+19.93
993.62%
1 gen 2009 anni
8.685
-13.251
-60.41%
1 gen 2010 anni
13.408
+4.723
54.38%
1 gen 2011 anni
6.312
-7.096
-52.92%
1 gen 2012 anni
14.547
+8.234
130.46%
1 gen 2013 anni
13.924
-0.623
-4.28%
1 gen 2014 anni
18.659
+4.735
34.0%
1 gen 2015 anni
1.4
-17.259
-92.5%
1 gen 2016 anni
13.155
+11.755
839.86%
Classificazione dei paesi secondo i statistiche attuali per anni