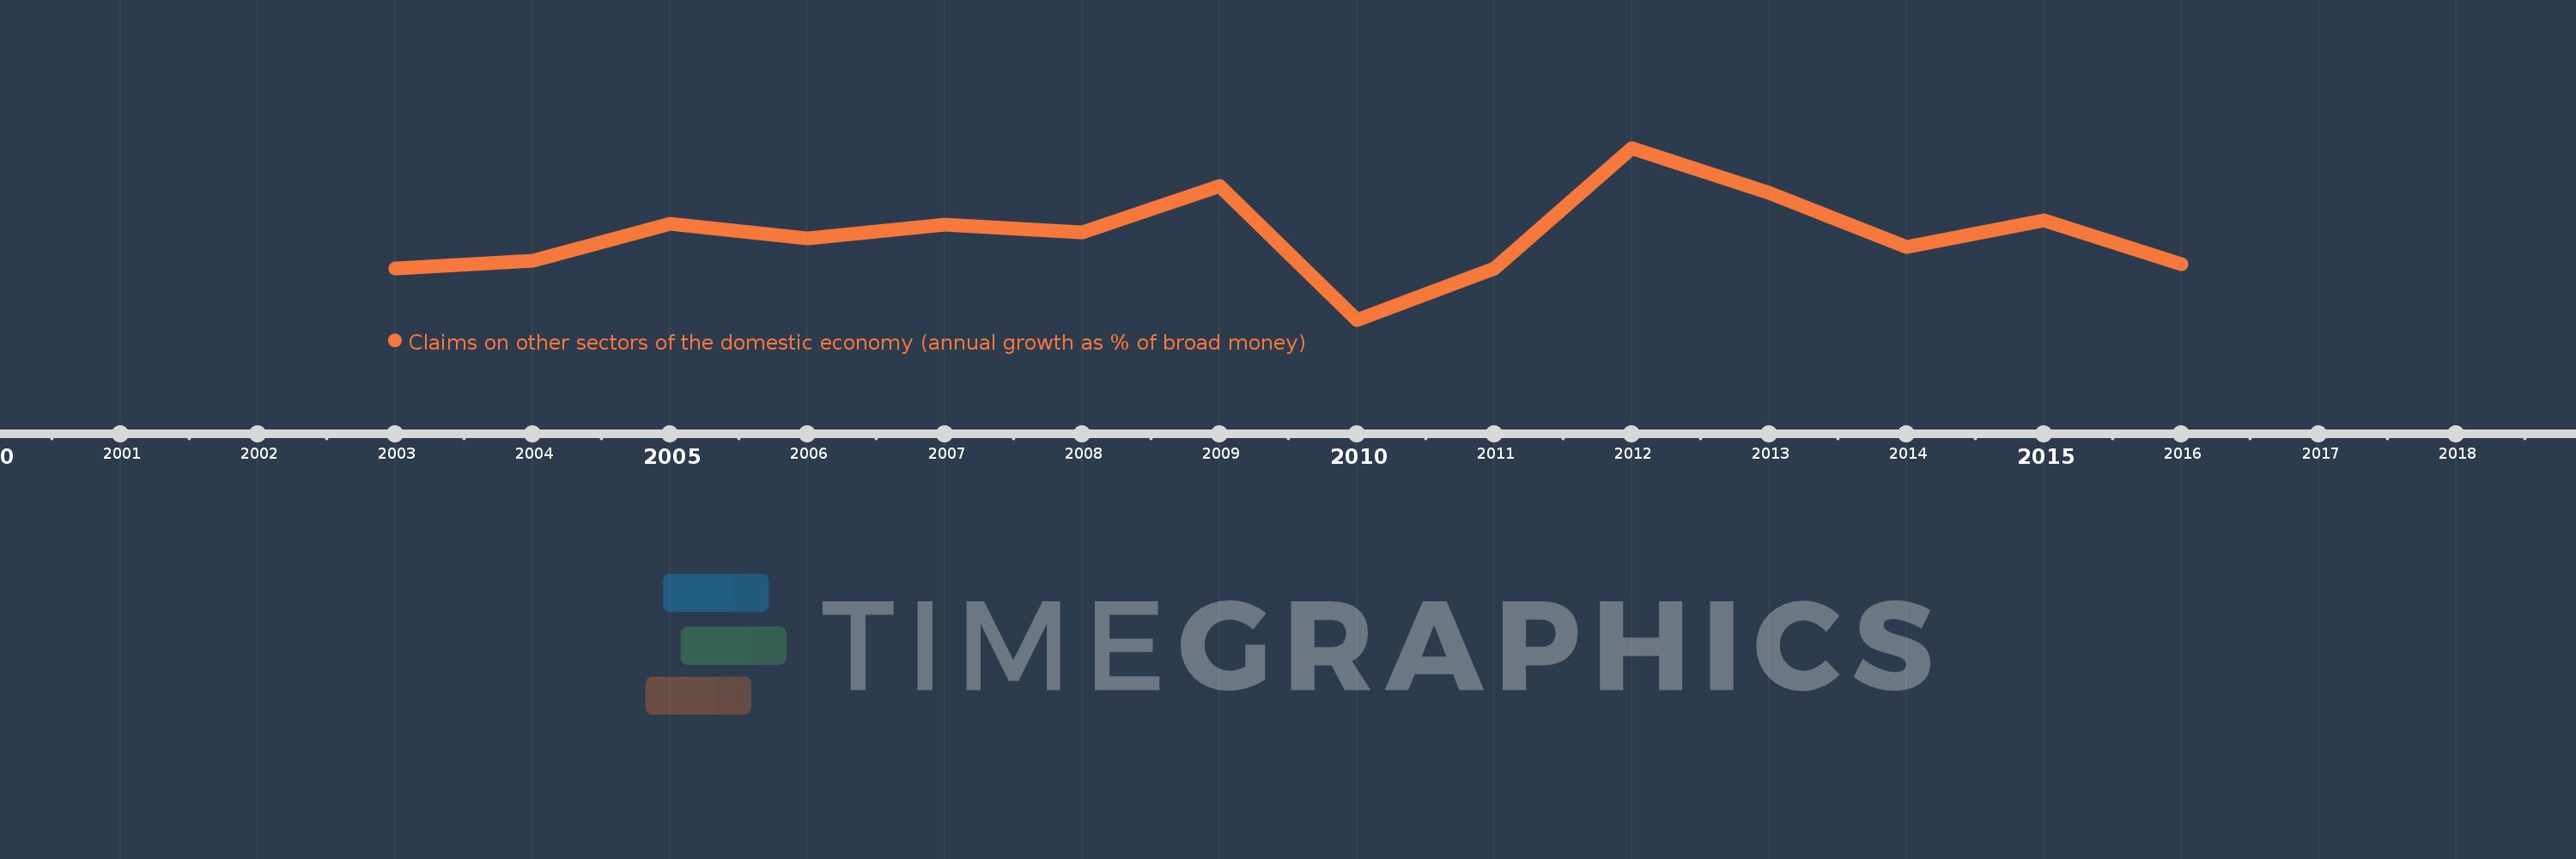
Questa scala temporale mostra un grafico dal 2003 anno al 2016 anno. Rwanda. I dati fino ad 2002 anno non disponibili. Il numero di osservazioni attuali secondo i date: 14.
La fonte (nome):
Indicatori dello sviluppo mondiale
La fonte (organizzazione):
International Monetary Fund, International Financial Statistics and data files.
Categorie:
Financial Sector
sono stati aggiornati
23 apr 2017 anni
Indicatori delle variazioni dei valori per anni
In media:
17.848
Minima:
-2.778
1 gen 2010 anni
Massimo:
39.223
1 gen 2012 anni
Alla data di osservazione
Valore
Variazione assoluta
La variazione rispetto al valore precedente
1 gen 2003 anni
9.75
+9.75
0.0%
1 gen 2004 anni
11.678
+1.928
19.78%
1 gen 2005 anni
20.584
+8.906
76.26%
1 gen 2006 anni
17.1
-3.484
-16.93%
1 gen 2007 anni
20.482
+3.383
19.78%
1 gen 2008 anni
18.52
-1.962
-9.58%
1 gen 2009 anni
29.964
+11.444
61.79%
1 gen 2010 anni
-2.778
-32.742
-109.27%
1 gen 2011 anni
9.806
+12.584
-453.05%
1 gen 2012 anni
39.223
+29.416
299.97%
1 gen 2013 anni
28.344
-10.879
-27.74%
1 gen 2014 anni
15.047
-13.297
-46.91%
1 gen 2015 anni
21.427
+6.38
42.4%
1 gen 2016 anni
10.723
-10.704
-49.95%
Classificazione dei paesi secondo i statistiche attuali per anni