29
/
en
AIzaSyAYiBZKx7MnpbEhh9jyipgxe19OcubqV5w
April 1, 2024
95884
Burundi
BDI
true
2
1
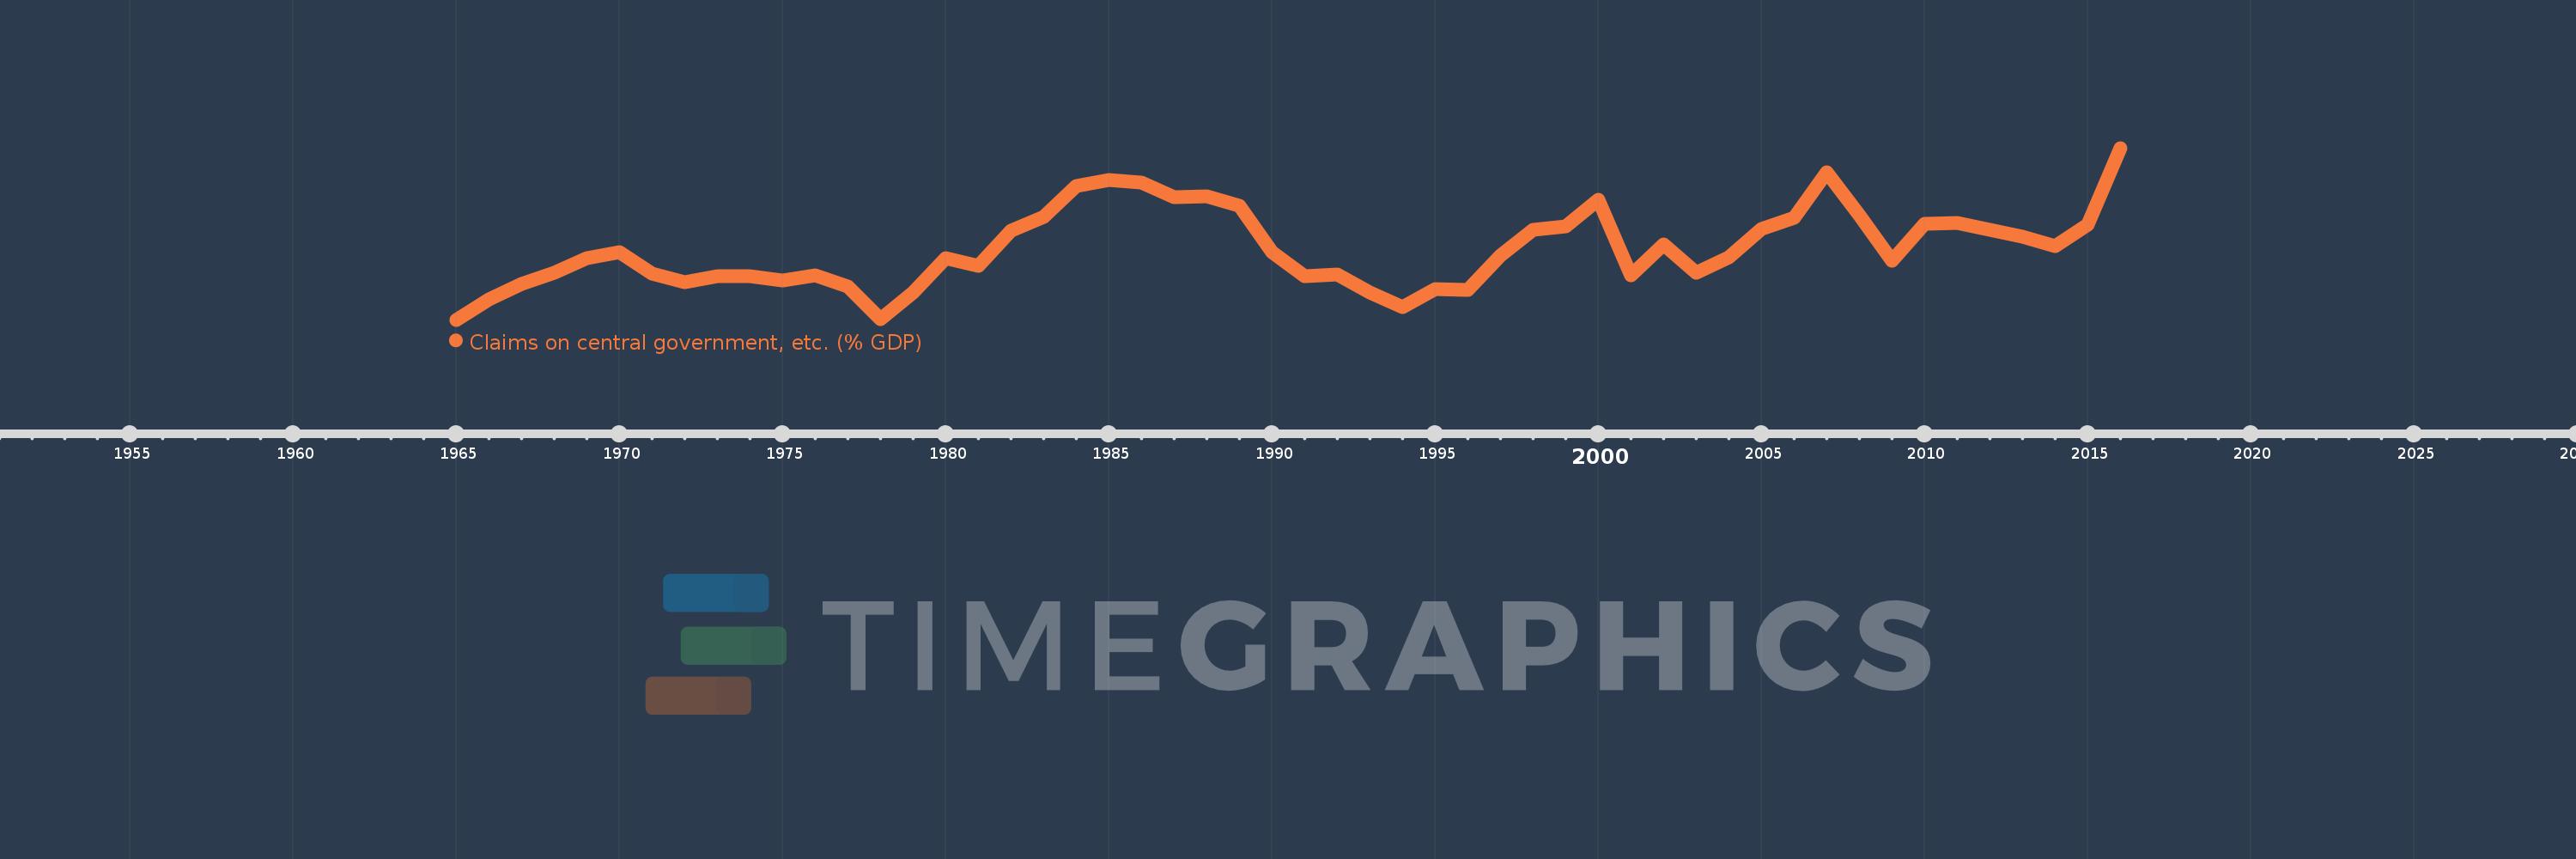
Claims on central government, etc. (% GDP)
2016,2015,2014,2013,2012,2011,2010,2009,2008,2007,2006,2005,2004,2003,2002,2001,2000,1999,1998,1997,1996,1995,1994,1993,1992,1991,1990,1989,1988,1987,1986,1985,1984,1983,1982,1981,1980,1979,1978,1977,1976,1975,1974,1973,1972,1971,1970,1969,1968,1967,1966,1965
This statistics in other country:
AfghanistanAlbaniaAlgeriaAngolaAntigua and BarbudaArab WorldArgentinaArmeniaArubaAustraliaAustriaAzerbaijanBahamas, TheBahrainBangladeshBarbadosBelarusBelgiumBelizeBeninBhutanBoliviaBosnia and HerzegovinaBotswanaBrazilBrunei DarussalamBulgariaBurkina FasoBurundiCabo VerdeCambodiaCameroonCanadaCaribbean small statesCentral African RepublicCentral Europe and the BalticsChadChileChinaColombiaComorosCongo, Dem. Rep.Congo, Rep.Costa RicaCote d'IvoireCroatiaCyprusCzech RepublicDenmarkDjiboutiDominicaDominican RepublicEarly-demographic dividendEast Asia & PacificEast Asia & Pacific (excluding high income)East Asia & Pacific (IDA & IBRD countries)EcuadorEgypt, Arab Rep.El SalvadorEquatorial GuineaEritreaEstoniaEthiopiaEuro areaEurope & Central AsiaEurope & Central Asia (excluding high income)Europe & Central Asia (IDA & IBRD countries)European UnionFijiFinlandFragile and conflict affected situationsFranceGabonGambia, TheGeorgiaGermanyGhanaGreeceGrenadaGuatemalaGuineaGuinea-BissauGuyanaHaitiHeavily indebted poor countries (HIPC)High incomeHondurasHong Kong SAR, ChinaHungaryIBRD onlyIcelandIDA & IBRD totalIDA blendIDA onlyIDA totalIndiaIndonesiaIran, Islamic Rep.IraqIrelandIsraelItalyJamaicaJapanJordanKazakhstanKenyaKorea, Rep.KosovoKuwaitKyrgyz RepublicLao PDRLate-demographic dividendLatin America & Caribbean Latin America & Caribbean (excluding high income)Latin America & the Caribbean (IDA & IBRD countries)LatviaLeast developed countries: UN classificationLebanonLesothoLiberiaLibyaLithuaniaLow & middle incomeLow incomeLower middle incomeLuxembourgMacao SAR, ChinaMacedonia, FYRMadagascarMalawiMalaysiaMaldivesMaliMaltaMauritaniaMauritiusMexicoMicronesia, Fed. Sts.Middle East & North AfricaMiddle East & North Africa (excluding high income)Middle East & North Africa (IDA & IBRD countries)Middle incomeMoldovaMongoliaMontenegroMoroccoMozambiqueMyanmarNamibiaNepalNetherlandsNew ZealandNicaraguaNigerNigeriaNorth AmericaNorwayOECD membersOmanOther small statesPacific island small statesPakistanPanamaPapua New GuineaParaguayPeruPhilippinesPolandPortugalPost-demographic dividendPre-demographic dividendQatarRomaniaRussian FederationRwandaSamoaSao Tome and PrincipeSaudi ArabiaSenegalSerbiaSeychellesSierra LeoneSingaporeSlovak RepublicSloveniaSmall statesSolomon IslandsSouth AfricaSouth AsiaSouth Asia (IDA & IBRD)South SudanSpainSri LankaSt. Kitts and NevisSt. LuciaSt. Vincent and the GrenadinesSub-Saharan Africa Sub-Saharan Africa (excluding high income)Sub-Saharan Africa (IDA & IBRD countries)SudanSurinameSwazilandSwedenSwitzerlandSyrian Arab RepublicTajikistanTanzaniaThailandTimor-LesteTogoTongaTrinidad and TobagoTunisiaTurkeyUgandaUkraineUnited Arab EmiratesUnited KingdomUnited StatesUpper middle incomeUruguayVanuatuVenezuela, RBVietnamWest Bank and GazaWorldYemen, Rep.ZambiaZimbabwe Timeline:
This timeline shows a graph from 1965 to 2016 of Burundi. No data until 1964. Number of actual observations by date: 52.
Source name:
World Development Indicators
Source organization:
International Monetary Fund, International Financial Statistics and data files, and World Bank and OECD GDP estimates.
Categories, topics:
Financial Sector
Last updated:
apr 23, 2017
Indicators value changes by year
At the date of observation
Value
Absolute change
Change from previous value
jan 1, 1965
0.199
+0.199
0.0%
jan 1, 1966
1.796
+1.597
800.83%
jan 1, 1967
3.053
+1.257
69.96%
jan 1, 1968
3.928
+0.875
28.65%
jan 1, 1969
5.079
+1.151
29.31%
jan 1, 1970
5.572
+0.493
9.71%
jan 1, 1971
3.874
-1.698
-30.47%
jan 1, 1972
3.167
-0.708
-18.27%
jan 1, 1973
3.637
+0.47
14.85%
jan 1, 1974
3.677
+0.04
1.11%
jan 1, 1975
3.34
-0.337
-9.16%
jan 1, 1976
3.717
+0.376
11.27%
jan 1, 1977
2.852
-0.865
-23.28%
jan 1, 1978
0.279
-2.573
-90.23%
jan 1, 1979
2.351
+2.072
743.81%
jan 1, 1980
5.105
+2.754
117.15%
jan 1, 1981
4.459
-0.646
-12.66%
jan 1, 1982
7.301
+2.842
63.74%
jan 1, 1983
8.389
+1.087
14.89%
jan 1, 1984
10.786
+2.397
28.58%
jan 1, 1985
11.302
+0.516
4.78%
jan 1, 1986
11.111
-0.191
-1.69%
jan 1, 1987
9.949
-1.162
-10.46%
jan 1, 1988
10.018
+0.069
0.7%
jan 1, 1989
9.276
-0.743
-7.41%
jan 1, 1990
5.579
-3.696
-39.85%
jan 1, 1991
3.657
-1.922
-34.45%
jan 1, 1992
3.796
+0.139
3.81%
jan 1, 1993
2.373
-1.423
-37.48%
jan 1, 1994
1.222
-1.151
-48.5%
jan 1, 1995
2.663
+1.44
117.85%
jan 1, 1996
2.54
-0.122
-4.6%
jan 1, 1997
5.307
+2.767
108.92%
jan 1, 1998
7.341
+2.034
38.32%
jan 1, 1999
7.638
+0.297
4.05%
jan 1, 2000
9.731
+2.093
27.4%
jan 1, 2001
3.712
-6.019
-61.85%
jan 1, 2002
6.163
+2.451
66.04%
jan 1, 2003
3.902
-2.262
-36.7%
jan 1, 2004
5.167
+1.266
32.44%
jan 1, 2005
7.429
+2.261
43.76%
jan 1, 2006
8.325
+0.896
12.06%
jan 1, 2007
11.938
+3.613
43.4%
jan 1, 2008
8.466
-3.472
-29.08%
jan 1, 2009
4.917
-3.549
-41.92%
jan 1, 2010
7.847
+2.93
59.58%
jan 1, 2011
7.856
+0.009
0.11%
jan 1, 2012
7.343
-0.513
-6.53%
jan 1, 2013
6.777
-0.566
-7.71%
jan 1, 2014
6.03
-0.746
-11.01%
jan 1, 2015
7.734
+1.704
28.26%
jan 1, 2016
13.84
+6.106
78.95%
Ranking of countries by current statistics by years


Comments: