29
/
en
AIzaSyAYiBZKx7MnpbEhh9jyipgxe19OcubqV5w
April 1, 2024
110680
Congo, Rep.
COG
true
2
1
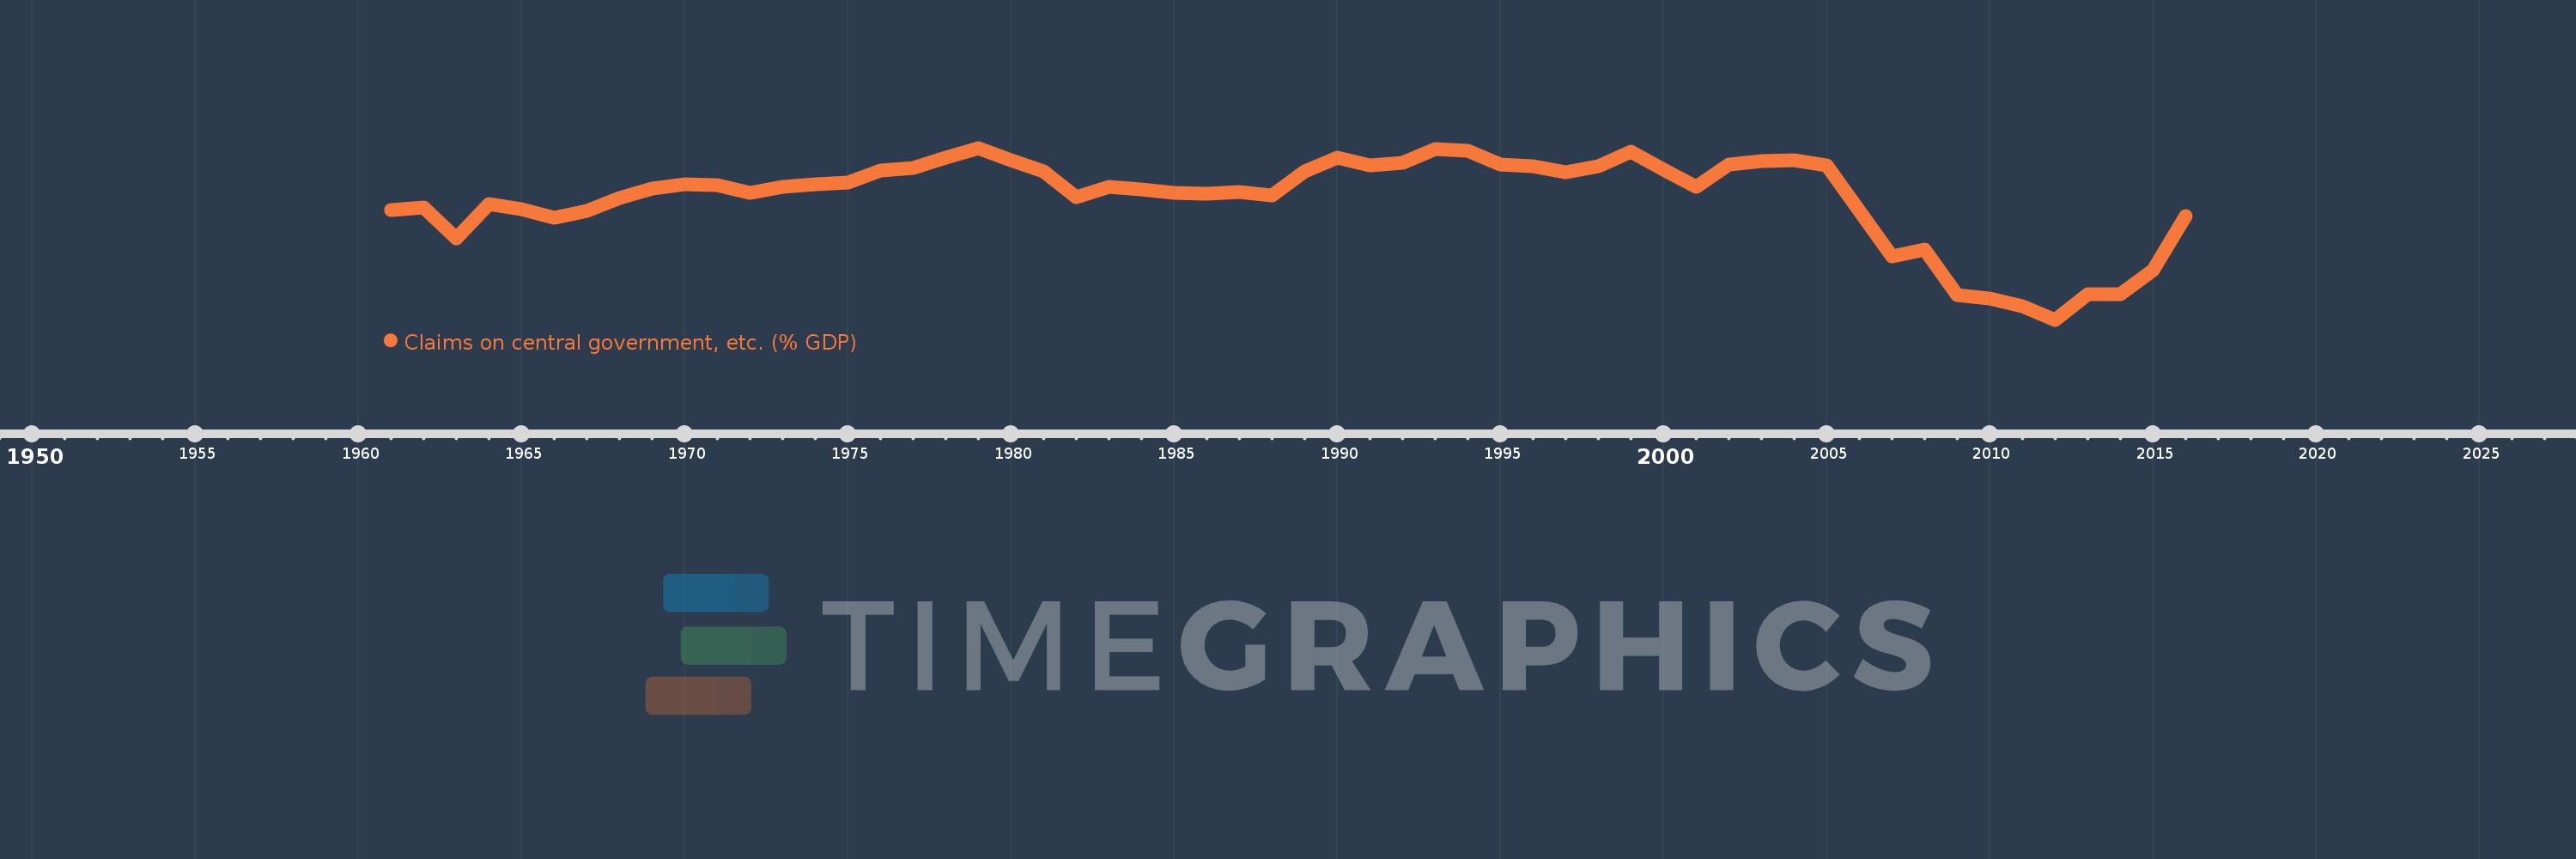
Claims on central government, etc. (% GDP)
2016,2015,2014,2013,2012,2011,2010,2009,2008,2007,2006,2005,2004,2003,2002,2001,2000,1999,1998,1997,1996,1995,1994,1993,1992,1991,1990,1989,1988,1987,1986,1985,1984,1983,1982,1981,1980,1979,1978,1977,1976,1975,1974,1973,1972,1971,1970,1969,1968,1967,1966,1965,1964,1963,1962,1961
This statistics in other country:
AfghanistanAlbaniaAlgeriaAngolaAntigua and BarbudaArab WorldArgentinaArmeniaArubaAustraliaAustriaAzerbaijanBahamas, TheBahrainBangladeshBarbadosBelarusBelgiumBelizeBeninBhutanBoliviaBosnia and HerzegovinaBotswanaBrazilBrunei DarussalamBulgariaBurkina FasoBurundiCabo VerdeCambodiaCameroonCanadaCaribbean small statesCentral African RepublicCentral Europe and the BalticsChadChileChinaColombiaComorosCongo, Dem. Rep.Congo, Rep.Costa RicaCote d'IvoireCroatiaCyprusCzech RepublicDenmarkDjiboutiDominicaDominican RepublicEarly-demographic dividendEast Asia & PacificEast Asia & Pacific (excluding high income)East Asia & Pacific (IDA & IBRD countries)EcuadorEgypt, Arab Rep.El SalvadorEquatorial GuineaEritreaEstoniaEthiopiaEuro areaEurope & Central AsiaEurope & Central Asia (excluding high income)Europe & Central Asia (IDA & IBRD countries)European UnionFijiFinlandFragile and conflict affected situationsFranceGabonGambia, TheGeorgiaGermanyGhanaGreeceGrenadaGuatemalaGuineaGuinea-BissauGuyanaHaitiHeavily indebted poor countries (HIPC)High incomeHondurasHong Kong SAR, ChinaHungaryIBRD onlyIcelandIDA & IBRD totalIDA blendIDA onlyIDA totalIndiaIndonesiaIran, Islamic Rep.IraqIrelandIsraelItalyJamaicaJapanJordanKazakhstanKenyaKorea, Rep.KosovoKuwaitKyrgyz RepublicLao PDRLate-demographic dividendLatin America & Caribbean Latin America & Caribbean (excluding high income)Latin America & the Caribbean (IDA & IBRD countries)LatviaLeast developed countries: UN classificationLebanonLesothoLiberiaLibyaLithuaniaLow & middle incomeLow incomeLower middle incomeLuxembourgMacao SAR, ChinaMacedonia, FYRMadagascarMalawiMalaysiaMaldivesMaliMaltaMauritaniaMauritiusMexicoMicronesia, Fed. Sts.Middle East & North AfricaMiddle East & North Africa (excluding high income)Middle East & North Africa (IDA & IBRD countries)Middle incomeMoldovaMongoliaMontenegroMoroccoMozambiqueMyanmarNamibiaNepalNetherlandsNew ZealandNicaraguaNigerNigeriaNorth AmericaNorwayOECD membersOmanOther small statesPacific island small statesPakistanPanamaPapua New GuineaParaguayPeruPhilippinesPolandPortugalPost-demographic dividendPre-demographic dividendQatarRomaniaRussian FederationRwandaSamoaSao Tome and PrincipeSaudi ArabiaSenegalSerbiaSeychellesSierra LeoneSingaporeSlovak RepublicSloveniaSmall statesSolomon IslandsSouth AfricaSouth AsiaSouth Asia (IDA & IBRD)South SudanSpainSri LankaSt. Kitts and NevisSt. LuciaSt. Vincent and the GrenadinesSub-Saharan Africa Sub-Saharan Africa (excluding high income)Sub-Saharan Africa (IDA & IBRD countries)SudanSurinameSwazilandSwedenSwitzerlandSyrian Arab RepublicTajikistanTanzaniaThailandTimor-LesteTogoTongaTrinidad and TobagoTunisiaTurkeyUgandaUkraineUnited Arab EmiratesUnited KingdomUnited StatesUpper middle incomeUruguayVanuatuVenezuela, RBVietnamWest Bank and GazaWorldYemen, Rep.ZambiaZimbabwe Timeline:
This timeline shows a graph from 1961 to 2016 of Congo, Rep.. No data until 1960. Number of actual observations by date: 56.
Source name:
World Development Indicators
Source organization:
International Monetary Fund, International Financial Statistics and data files, and World Bank and OECD GDP estimates.
Categories, topics:
Financial Sector
Last updated:
apr 23, 2017
Indicators value changes by year
Minimum:
-24.12
jan 1, 2012
Maximum:
11.551
jan 1, 1979
At the date of observation
Value
Absolute change
Change from previous value
jan 1, 1961
-1.269
-1.269
0.0%
jan 1, 1962
-0.726
+0.544
-42.82%
jan 1, 1963
-7.255
-6.529
899.56%
jan 1, 1964
-0.047
+7.208
-99.35%
jan 1, 1965
-1.253
-1.205
2.54K%
jan 1, 1966
-2.984
-1.731
138.16%
jan 1, 1967
-1.476
+1.508
-50.53%
jan 1, 1968
1.113
+2.589
-175.41%
jan 1, 1969
3.125
+2.012
180.81%
jan 1, 1970
3.972
+0.847
27.1%
jan 1, 1971
3.807
-0.166
-4.17%
jan 1, 1972
2.143
-1.663
-43.7%
jan 1, 1973
3.555
+1.411
65.86%
jan 1, 1974
4.032
+0.478
13.44%
jan 1, 1975
4.361
+0.328
8.14%
jan 1, 1976
6.905
+2.545
58.35%
jan 1, 1977
7.417
+0.511
7.41%
jan 1, 1978
9.534
+2.118
28.55%
jan 1, 1979
11.551
+2.017
21.15%
jan 1, 1980
8.96
-2.591
-22.43%
jan 1, 1981
6.771
-2.189
-24.43%
jan 1, 1982
1.395
-5.375
-79.39%
jan 1, 1983
3.39
+1.995
142.98%
jan 1, 1984
2.993
-0.397
-11.71%
jan 1, 1985
2.153
-0.841
-28.08%
jan 1, 1986
1.964
-0.189
-8.79%
jan 1, 1987
2.318
+0.354
18.04%
jan 1, 1988
1.753
-0.565
-24.35%
jan 1, 1989
6.659
+4.906
279.79%
jan 1, 1990
9.624
+2.965
44.52%
jan 1, 1991
7.933
-1.691
-17.57%
jan 1, 1992
8.442
+0.508
6.41%
jan 1, 1993
11.327
+2.885
34.18%
jan 1, 1994
10.905
-0.422
-3.72%
jan 1, 1995
8.101
-2.805
-25.72%
jan 1, 1996
7.835
-0.266
-3.28%
jan 1, 1997
6.561
-1.274
-16.26%
jan 1, 1998
7.779
+1.218
18.56%
jan 1, 1999
10.704
+2.925
37.6%
jan 1, 2000
7.078
-3.626
-33.87%
jan 1, 2001
3.4
-3.678
-51.96%
jan 1, 2002
8.104
+4.704
138.35%
jan 1, 2003
8.738
+0.635
7.83%
jan 1, 2004
9.072
+0.334
3.82%
jan 1, 2005
7.963
-1.109
-12.22%
jan 1, 2006
-1.576
-9.539
-119.79%
jan 1, 2007
-10.967
-9.391
595.96%
jan 1, 2008
-9.622
+1.345
-12.26%
jan 1, 2009
-19.074
-9.452
98.23%
jan 1, 2010
-19.716
-0.642
3.36%
jan 1, 2011
-21.32
-1.605
8.14%
jan 1, 2012
-24.12
-2.8
13.13%
jan 1, 2013
-18.845
+5.275
-21.87%
jan 1, 2014
-18.867
-0.022
0.12%
jan 1, 2015
-13.861
+5.007
-26.54%
jan 1, 2016
-2.642
+11.218
-80.94%
Ranking of countries by current statistics by years


Comments: