29
/
en
AIzaSyAYiBZKx7MnpbEhh9jyipgxe19OcubqV5w
April 1, 2024
163569
Japan
JPN
true
2
1
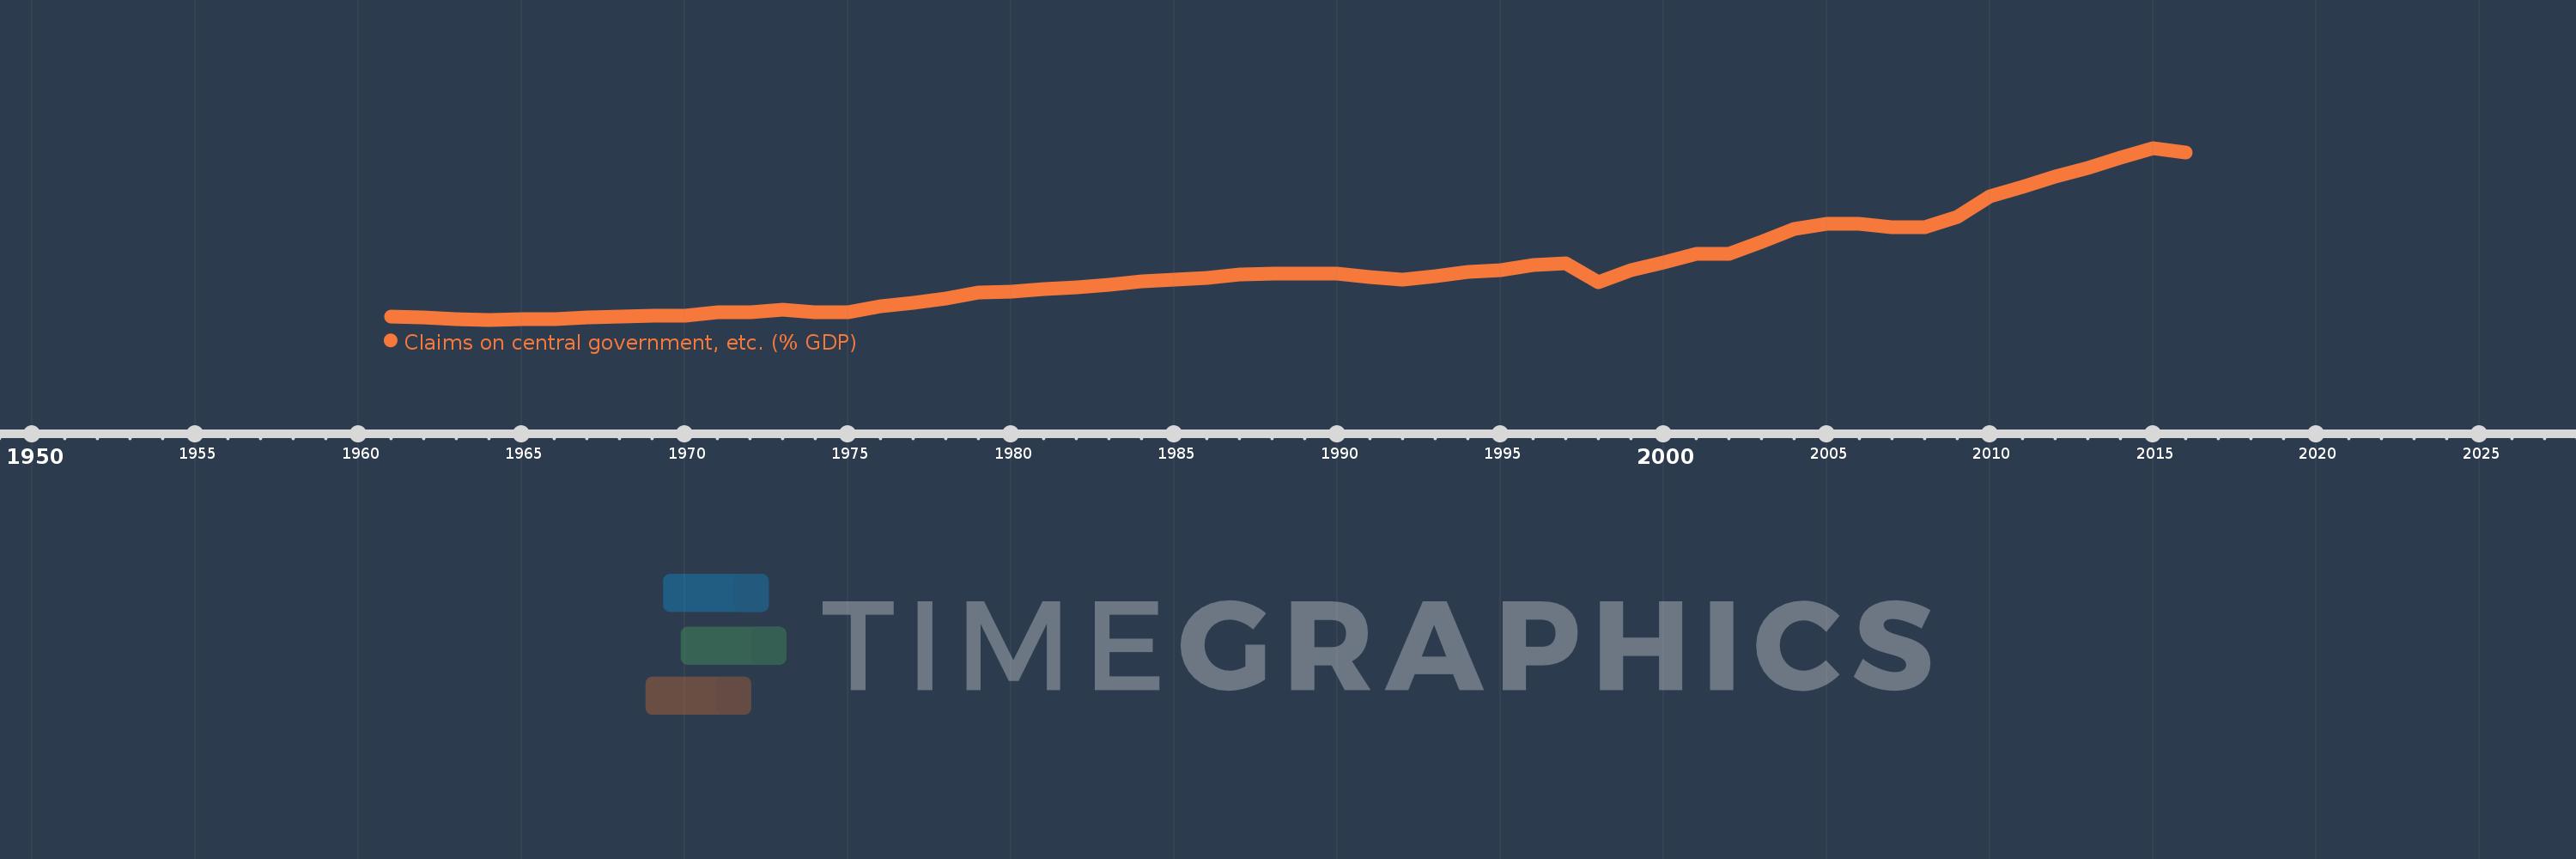
Claims on central government, etc. (% GDP)
2016,2015,2014,2013,2012,2011,2010,2009,2008,2007,2006,2005,2004,2003,2002,2001,2000,1999,1998,1997,1996,1995,1994,1993,1992,1991,1990,1989,1988,1987,1986,1985,1984,1983,1982,1981,1980,1979,1978,1977,1976,1975,1974,1973,1972,1971,1970,1969,1968,1967,1966,1965,1964,1963,1962,1961
This statistics in other country:
AfghanistanAlbaniaAlgeriaAngolaAntigua and BarbudaArab WorldArgentinaArmeniaArubaAustraliaAustriaAzerbaijanBahamas, TheBahrainBangladeshBarbadosBelarusBelgiumBelizeBeninBhutanBoliviaBosnia and HerzegovinaBotswanaBrazilBrunei DarussalamBulgariaBurkina FasoBurundiCabo VerdeCambodiaCameroonCanadaCaribbean small statesCentral African RepublicCentral Europe and the BalticsChadChileChinaColombiaComorosCongo, Dem. Rep.Congo, Rep.Costa RicaCote d'IvoireCroatiaCyprusCzech RepublicDenmarkDjiboutiDominicaDominican RepublicEarly-demographic dividendEast Asia & PacificEast Asia & Pacific (excluding high income)East Asia & Pacific (IDA & IBRD countries)EcuadorEgypt, Arab Rep.El SalvadorEquatorial GuineaEritreaEstoniaEthiopiaEuro areaEurope & Central AsiaEurope & Central Asia (excluding high income)Europe & Central Asia (IDA & IBRD countries)European UnionFijiFinlandFragile and conflict affected situationsFranceGabonGambia, TheGeorgiaGermanyGhanaGreeceGrenadaGuatemalaGuineaGuinea-BissauGuyanaHaitiHeavily indebted poor countries (HIPC)High incomeHondurasHong Kong SAR, ChinaHungaryIBRD onlyIcelandIDA & IBRD totalIDA blendIDA onlyIDA totalIndiaIndonesiaIran, Islamic Rep.IraqIrelandIsraelItalyJamaicaJapanJordanKazakhstanKenyaKorea, Rep.KosovoKuwaitKyrgyz RepublicLao PDRLate-demographic dividendLatin America & Caribbean Latin America & Caribbean (excluding high income)Latin America & the Caribbean (IDA & IBRD countries)LatviaLeast developed countries: UN classificationLebanonLesothoLiberiaLibyaLithuaniaLow & middle incomeLow incomeLower middle incomeLuxembourgMacao SAR, ChinaMacedonia, FYRMadagascarMalawiMalaysiaMaldivesMaliMaltaMauritaniaMauritiusMexicoMicronesia, Fed. Sts.Middle East & North AfricaMiddle East & North Africa (excluding high income)Middle East & North Africa (IDA & IBRD countries)Middle incomeMoldovaMongoliaMontenegroMoroccoMozambiqueMyanmarNamibiaNepalNetherlandsNew ZealandNicaraguaNigerNigeriaNorth AmericaNorwayOECD membersOmanOther small statesPacific island small statesPakistanPanamaPapua New GuineaParaguayPeruPhilippinesPolandPortugalPost-demographic dividendPre-demographic dividendQatarRomaniaRussian FederationRwandaSamoaSao Tome and PrincipeSaudi ArabiaSenegalSerbiaSeychellesSierra LeoneSingaporeSlovak RepublicSloveniaSmall statesSolomon IslandsSouth AfricaSouth AsiaSouth Asia (IDA & IBRD)South SudanSpainSri LankaSt. Kitts and NevisSt. LuciaSt. Vincent and the GrenadinesSub-Saharan Africa Sub-Saharan Africa (excluding high income)Sub-Saharan Africa (IDA & IBRD countries)SudanSurinameSwazilandSwedenSwitzerlandSyrian Arab RepublicTajikistanTanzaniaThailandTimor-LesteTogoTongaTrinidad and TobagoTunisiaTurkeyUgandaUkraineUnited Arab EmiratesUnited KingdomUnited StatesUpper middle incomeUruguayVanuatuVenezuela, RBVietnamWest Bank and GazaWorldYemen, Rep.ZambiaZimbabwe Timeline:
This timeline shows a graph from 1961 to 2016 of Japan. No data until 1960. Number of actual observations by date: 56.
Source name:
World Development Indicators
Source organization:
International Monetary Fund, International Financial Statistics and data files, and World Bank and OECD GDP estimates.
Categories, topics:
Financial Sector
Last updated:
apr 23, 2017
Indicators value changes by year
Maximum:
138.179
jan 1, 2015
At the date of observation
Value
Absolute change
Change from previous value
jan 1, 1961
3.994
+3.994
0.0%
jan 1, 1962
2.892
-1.102
-27.6%
jan 1, 1963
1.757
-1.135
-39.25%
jan 1, 1964
1.211
-0.546
-31.06%
jan 1, 1965
1.577
+0.366
30.19%
jan 1, 1966
2.022
+0.445
28.24%
jan 1, 1967
3.15
+1.129
55.82%
jan 1, 1968
3.927
+0.777
24.65%
jan 1, 1969
4.108
+0.181
4.6%
jan 1, 1970
4.357
+0.249
6.06%
jan 1, 1971
7.199
+2.842
65.22%
jan 1, 1972
7.374
+0.176
2.44%
jan 1, 1973
9.27
+1.895
25.7%
jan 1, 1974
7.132
-2.138
-23.07%
jan 1, 1975
7.495
+0.363
5.1%
jan 1, 1976
11.888
+4.393
58.61%
jan 1, 1977
14.947
+3.059
25.73%
jan 1, 1978
18.08
+3.133
20.96%
jan 1, 1979
22.602
+4.522
25.01%
jan 1, 1980
23.673
+1.071
4.74%
jan 1, 1981
25.411
+1.738
7.34%
jan 1, 1982
26.788
+1.377
5.42%
jan 1, 1983
29.384
+2.596
9.69%
jan 1, 1984
31.738
+2.354
8.01%
jan 1, 1985
33.528
+1.789
5.64%
jan 1, 1986
34.511
+0.983
2.93%
jan 1, 1987
37.622
+3.11
9.01%
jan 1, 1988
38.043
+0.422
1.12%
jan 1, 1989
38.126
+0.083
0.22%
jan 1, 1990
37.733
-0.394
-1.03%
jan 1, 1991
35.224
-2.509
-6.65%
jan 1, 1992
33.274
-1.949
-5.53%
jan 1, 1993
35.914
+2.64
7.93%
jan 1, 1994
39.684
+3.77
10.5%
jan 1, 1995
40.754
+1.07
2.7%
jan 1, 1996
44.761
+4.007
9.83%
jan 1, 1997
46.019
+1.258
2.81%
jan 1, 1998
30.82
-15.199
-33.03%
jan 1, 1999
40.804
+9.984
32.39%
jan 1, 2000
47.153
+6.349
15.56%
jan 1, 2001
53.833
+6.68
14.17%
jan 1, 2002
53.957
+0.124
0.23%
jan 1, 2003
63.06
+9.104
16.87%
jan 1, 2004
73.322
+10.262
16.27%
jan 1, 2005
78.041
+4.718
6.44%
jan 1, 2006
77.831
-0.21
-0.27%
jan 1, 2007
75.101
-2.73
-3.51%
jan 1, 2008
74.718
-0.383
-0.51%
jan 1, 2009
83.277
+8.559
11.46%
jan 1, 2010
99.765
+16.488
19.8%
jan 1, 2011
106.994
+7.229
7.25%
jan 1, 2012
115.436
+8.442
7.89%
jan 1, 2013
122.31
+6.875
5.96%
jan 1, 2014
130.364
+8.054
6.58%
jan 1, 2015
138.179
+7.815
5.99%
jan 1, 2016
134.606
-3.572
-2.59%
Ranking of countries by current statistics by years


Comments: