29
/
en
AIzaSyAYiBZKx7MnpbEhh9jyipgxe19OcubqV5w
April 1, 2024
249721
St. Kitts and Nevis
KNA
true
2
1
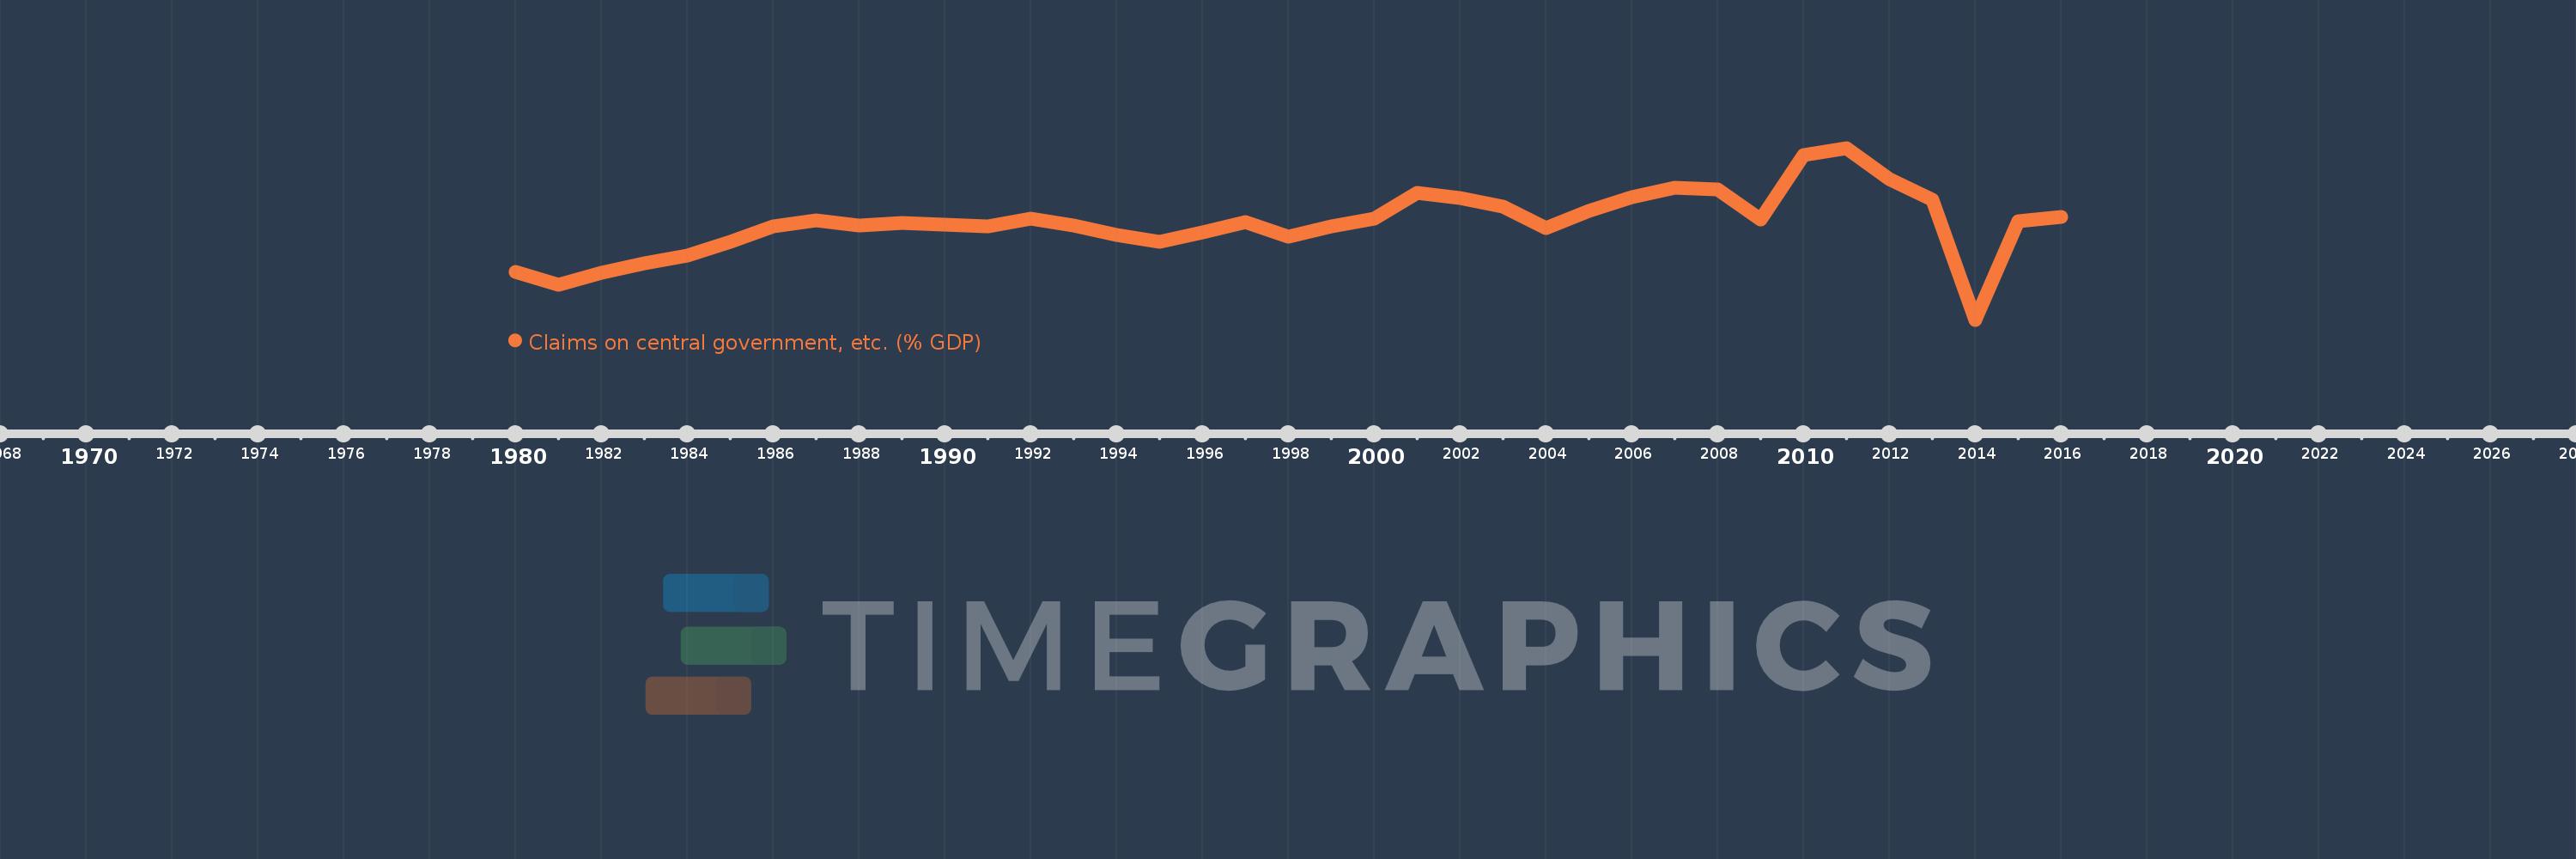
Claims on central government, etc. (% GDP)
2016,2015,2014,2013,2012,2011,2010,2009,2008,2007,2006,2005,2004,2003,2002,2001,2000,1999,1998,1997,1996,1995,1994,1993,1992,1991,1990,1989,1988,1987,1986,1985,1984,1983,1982,1981,1980
This statistics in other country:
AfghanistanAlbaniaAlgeriaAngolaAntigua and BarbudaArab WorldArgentinaArmeniaArubaAustraliaAustriaAzerbaijanBahamas, TheBahrainBangladeshBarbadosBelarusBelgiumBelizeBeninBhutanBoliviaBosnia and HerzegovinaBotswanaBrazilBrunei DarussalamBulgariaBurkina FasoBurundiCabo VerdeCambodiaCameroonCanadaCaribbean small statesCentral African RepublicCentral Europe and the BalticsChadChileChinaColombiaComorosCongo, Dem. Rep.Congo, Rep.Costa RicaCote d'IvoireCroatiaCyprusCzech RepublicDenmarkDjiboutiDominicaDominican RepublicEarly-demographic dividendEast Asia & PacificEast Asia & Pacific (excluding high income)East Asia & Pacific (IDA & IBRD countries)EcuadorEgypt, Arab Rep.El SalvadorEquatorial GuineaEritreaEstoniaEthiopiaEuro areaEurope & Central AsiaEurope & Central Asia (excluding high income)Europe & Central Asia (IDA & IBRD countries)European UnionFijiFinlandFragile and conflict affected situationsFranceGabonGambia, TheGeorgiaGermanyGhanaGreeceGrenadaGuatemalaGuineaGuinea-BissauGuyanaHaitiHeavily indebted poor countries (HIPC)High incomeHondurasHong Kong SAR, ChinaHungaryIBRD onlyIcelandIDA & IBRD totalIDA blendIDA onlyIDA totalIndiaIndonesiaIran, Islamic Rep.IraqIrelandIsraelItalyJamaicaJapanJordanKazakhstanKenyaKorea, Rep.KosovoKuwaitKyrgyz RepublicLao PDRLate-demographic dividendLatin America & Caribbean Latin America & Caribbean (excluding high income)Latin America & the Caribbean (IDA & IBRD countries)LatviaLeast developed countries: UN classificationLebanonLesothoLiberiaLibyaLithuaniaLow & middle incomeLow incomeLower middle incomeLuxembourgMacao SAR, ChinaMacedonia, FYRMadagascarMalawiMalaysiaMaldivesMaliMaltaMauritaniaMauritiusMexicoMicronesia, Fed. Sts.Middle East & North AfricaMiddle East & North Africa (excluding high income)Middle East & North Africa (IDA & IBRD countries)Middle incomeMoldovaMongoliaMontenegroMoroccoMozambiqueMyanmarNamibiaNepalNetherlandsNew ZealandNicaraguaNigerNigeriaNorth AmericaNorwayOECD membersOmanOther small statesPacific island small statesPakistanPanamaPapua New GuineaParaguayPeruPhilippinesPolandPortugalPost-demographic dividendPre-demographic dividendQatarRomaniaRussian FederationRwandaSamoaSao Tome and PrincipeSaudi ArabiaSenegalSerbiaSeychellesSierra LeoneSingaporeSlovak RepublicSloveniaSmall statesSolomon IslandsSouth AfricaSouth AsiaSouth Asia (IDA & IBRD)South SudanSpainSri LankaSt. Kitts and NevisSt. LuciaSt. Vincent and the GrenadinesSub-Saharan Africa Sub-Saharan Africa (excluding high income)Sub-Saharan Africa (IDA & IBRD countries)SudanSurinameSwazilandSwedenSwitzerlandSyrian Arab RepublicTajikistanTanzaniaThailandTimor-LesteTogoTongaTrinidad and TobagoTunisiaTurkeyUgandaUkraineUnited Arab EmiratesUnited KingdomUnited StatesUpper middle incomeUruguayVanuatuVenezuela, RBVietnamWest Bank and GazaWorldYemen, Rep.ZambiaZimbabwe Timeline:
This timeline shows a graph from 1980 to 2016 of St. Kitts and Nevis. No data until 1979. Number of actual observations by date: 37.
Source name:
World Development Indicators
Source organization:
International Monetary Fund, International Financial Statistics and data files, and World Bank and OECD GDP estimates.
Categories, topics:
Financial Sector
Last updated:
apr 23, 2017
Indicators value changes by year
Minimum:
-18.559
jan 1, 2014
Maximum:
35.838
jan 1, 2011
At the date of observation
Value
Absolute change
Change from previous value
jan 1, 1980
-3.377
-3.377
0.0%
jan 1, 1981
-7.395
-4.018
118.97%
jan 1, 1982
-3.779
+3.616
-48.9%
jan 1, 1983
-0.609
+3.17
-83.88%
jan 1, 1984
1.777
+2.386
-391.61%
jan 1, 1985
6.005
+4.229
238.03%
jan 1, 1986
10.994
+4.989
83.08%
jan 1, 1987
12.992
+1.998
18.17%
jan 1, 1988
11.398
-1.594
-12.27%
jan 1, 1989
12.049
+0.651
5.71%
jan 1, 1990
11.432
-0.616
-5.12%
jan 1, 1991
11.095
-0.337
-2.95%
jan 1, 1992
13.481
+2.386
21.51%
jan 1, 1993
11.162
-2.319
-17.2%
jan 1, 1994
8.317
-2.845
-25.49%
jan 1, 1995
6.14
-2.176
-26.17%
jan 1, 1996
9.111
+2.971
48.38%
jan 1, 1997
12.415
+3.305
36.27%
jan 1, 1998
7.71
-4.706
-37.9%
jan 1, 1999
10.981
+3.271
42.43%
jan 1, 2000
13.47
+2.489
22.67%
jan 1, 2001
21.535
+8.065
59.87%
jan 1, 2002
20.066
-1.469
-6.82%
jan 1, 2003
17.229
-2.837
-14.14%
jan 1, 2004
10.566
-6.663
-38.67%
jan 1, 2005
15.977
+5.411
51.21%
jan 1, 2006
20.218
+4.242
26.55%
jan 1, 2007
23.138
+2.92
14.44%
jan 1, 2008
22.644
-0.494
-2.14%
jan 1, 2009
13.179
-9.464
-41.8%
jan 1, 2010
33.493
+20.314
154.13%
jan 1, 2011
35.838
+2.345
7.0%
jan 1, 2012
25.891
-9.947
-27.76%
jan 1, 2013
19.319
-6.572
-25.38%
jan 1, 2014
-18.559
-37.878
-196.07%
jan 1, 2015
12.578
+31.137
-167.77%
jan 1, 2016
14.107
+1.529
12.15%
Ranking of countries by current statistics by years


Comments: