29
/
en
AIzaSyAYiBZKx7MnpbEhh9jyipgxe19OcubqV5w
April 1, 2024
79257
Barbados
BRB
true
2
1
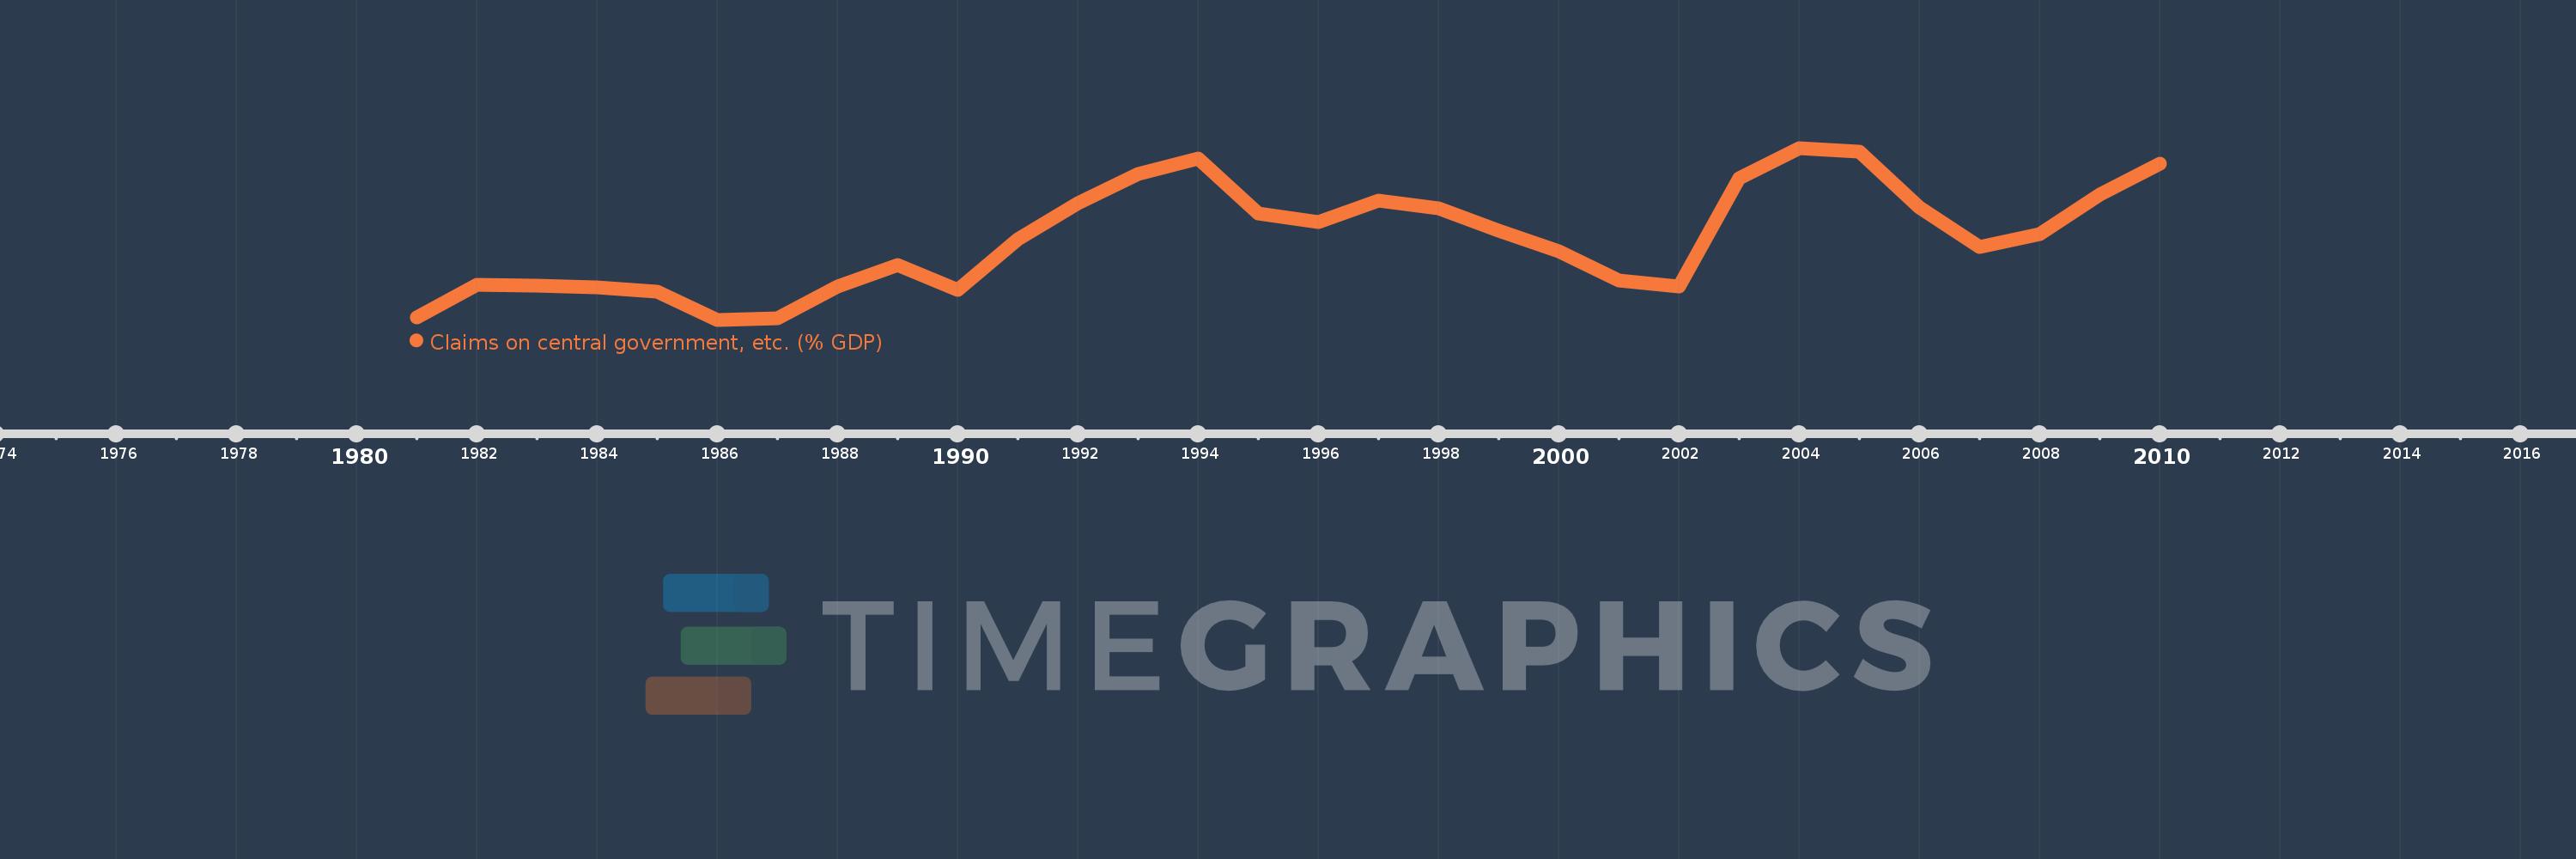
Claims on central government, etc. (% GDP)
2010,2009,2008,2007,2006,2005,2004,2003,2002,2001,2000,1999,1998,1997,1996,1995,1994,1993,1992,1991,1990,1989,1988,1987,1986,1985,1984,1983,1982,1981
This statistics in other country:
AfghanistanAlbaniaAlgeriaAngolaAntigua and BarbudaArab WorldArgentinaArmeniaArubaAustraliaAustriaAzerbaijanBahamas, TheBahrainBangladeshBarbadosBelarusBelgiumBelizeBeninBhutanBoliviaBosnia and HerzegovinaBotswanaBrazilBrunei DarussalamBulgariaBurkina FasoBurundiCabo VerdeCambodiaCameroonCanadaCaribbean small statesCentral African RepublicCentral Europe and the BalticsChadChileChinaColombiaComorosCongo, Dem. Rep.Congo, Rep.Costa RicaCote d'IvoireCroatiaCyprusCzech RepublicDenmarkDjiboutiDominicaDominican RepublicEarly-demographic dividendEast Asia & PacificEast Asia & Pacific (excluding high income)East Asia & Pacific (IDA & IBRD countries)EcuadorEgypt, Arab Rep.El SalvadorEquatorial GuineaEritreaEstoniaEthiopiaEuro areaEurope & Central AsiaEurope & Central Asia (excluding high income)Europe & Central Asia (IDA & IBRD countries)European UnionFijiFinlandFragile and conflict affected situationsFranceGabonGambia, TheGeorgiaGermanyGhanaGreeceGrenadaGuatemalaGuineaGuinea-BissauGuyanaHaitiHeavily indebted poor countries (HIPC)High incomeHondurasHong Kong SAR, ChinaHungaryIBRD onlyIcelandIDA & IBRD totalIDA blendIDA onlyIDA totalIndiaIndonesiaIran, Islamic Rep.IraqIrelandIsraelItalyJamaicaJapanJordanKazakhstanKenyaKorea, Rep.KosovoKuwaitKyrgyz RepublicLao PDRLate-demographic dividendLatin America & Caribbean Latin America & Caribbean (excluding high income)Latin America & the Caribbean (IDA & IBRD countries)LatviaLeast developed countries: UN classificationLebanonLesothoLiberiaLibyaLithuaniaLow & middle incomeLow incomeLower middle incomeLuxembourgMacao SAR, ChinaMacedonia, FYRMadagascarMalawiMalaysiaMaldivesMaliMaltaMauritaniaMauritiusMexicoMicronesia, Fed. Sts.Middle East & North AfricaMiddle East & North Africa (excluding high income)Middle East & North Africa (IDA & IBRD countries)Middle incomeMoldovaMongoliaMontenegroMoroccoMozambiqueMyanmarNamibiaNepalNetherlandsNew ZealandNicaraguaNigerNigeriaNorth AmericaNorwayOECD membersOmanOther small statesPacific island small statesPakistanPanamaPapua New GuineaParaguayPeruPhilippinesPolandPortugalPost-demographic dividendPre-demographic dividendQatarRomaniaRussian FederationRwandaSamoaSao Tome and PrincipeSaudi ArabiaSenegalSerbiaSeychellesSierra LeoneSingaporeSlovak RepublicSloveniaSmall statesSolomon IslandsSouth AfricaSouth AsiaSouth Asia (IDA & IBRD)South SudanSpainSri LankaSt. Kitts and NevisSt. LuciaSt. Vincent and the GrenadinesSub-Saharan Africa Sub-Saharan Africa (excluding high income)Sub-Saharan Africa (IDA & IBRD countries)SudanSurinameSwazilandSwedenSwitzerlandSyrian Arab RepublicTajikistanTanzaniaThailandTimor-LesteTogoTongaTrinidad and TobagoTunisiaTurkeyUgandaUkraineUnited Arab EmiratesUnited KingdomUnited StatesUpper middle incomeUruguayVanuatuVenezuela, RBVietnamWest Bank and GazaWorldYemen, Rep.ZambiaZimbabwe Timeline:
This timeline shows a graph from 1981 to 2010 of Barbados. No data until 1980. Number of actual observations by date: 30.
Source name:
World Development Indicators
Source organization:
International Monetary Fund, International Financial Statistics and data files, and World Bank and OECD GDP estimates.
Categories, topics:
Financial Sector
Last updated:
apr 23, 2017
Indicators value changes by year
Maximum:
15.989
jan 1, 2004
At the date of observation
Value
Absolute change
Change from previous value
jan 1, 1981
4.942
+4.942
0.0%
jan 1, 1982
7.042
+2.1
42.5%
jan 1, 1983
6.972
-0.07
-0.99%
jan 1, 1984
6.907
-0.065
-0.93%
jan 1, 1985
6.604
-0.303
-4.39%
jan 1, 1986
4.763
-1.841
-27.88%
jan 1, 1987
4.85
+0.087
1.82%
jan 1, 1988
6.919
+2.069
42.67%
jan 1, 1989
8.322
+1.403
20.27%
jan 1, 1990
6.711
-1.61
-19.35%
jan 1, 1991
9.995
+3.284
48.93%
jan 1, 1992
12.404
+2.408
24.1%
jan 1, 1993
14.262
+1.858
14.98%
jan 1, 1994
15.311
+1.049
7.36%
jan 1, 1995
11.703
-3.608
-23.57%
jan 1, 1996
11.147
-0.556
-4.75%
jan 1, 1997
12.532
+1.386
12.43%
jan 1, 1998
12.029
-0.503
-4.01%
jan 1, 1999
10.572
-1.457
-12.12%
jan 1, 2000
9.217
-1.355
-12.81%
jan 1, 2001
7.322
-1.895
-20.56%
jan 1, 2002
6.939
-0.383
-5.23%
jan 1, 2003
14.022
+7.083
102.07%
jan 1, 2004
15.989
+1.967
14.03%
jan 1, 2005
15.72
-0.269
-1.68%
jan 1, 2006
12.104
-3.616
-23.0%
jan 1, 2007
9.513
-2.591
-21.4%
jan 1, 2008
10.345
+0.832
8.74%
jan 1, 2009
12.923
+2.578
24.92%
jan 1, 2010
14.935
+2.012
15.57%
Ranking of countries by current statistics by years


Comments: