29
/
en
AIzaSyAYiBZKx7MnpbEhh9jyipgxe19OcubqV5w
April 1, 2024
53259
Other small states
OSS
false
2
1
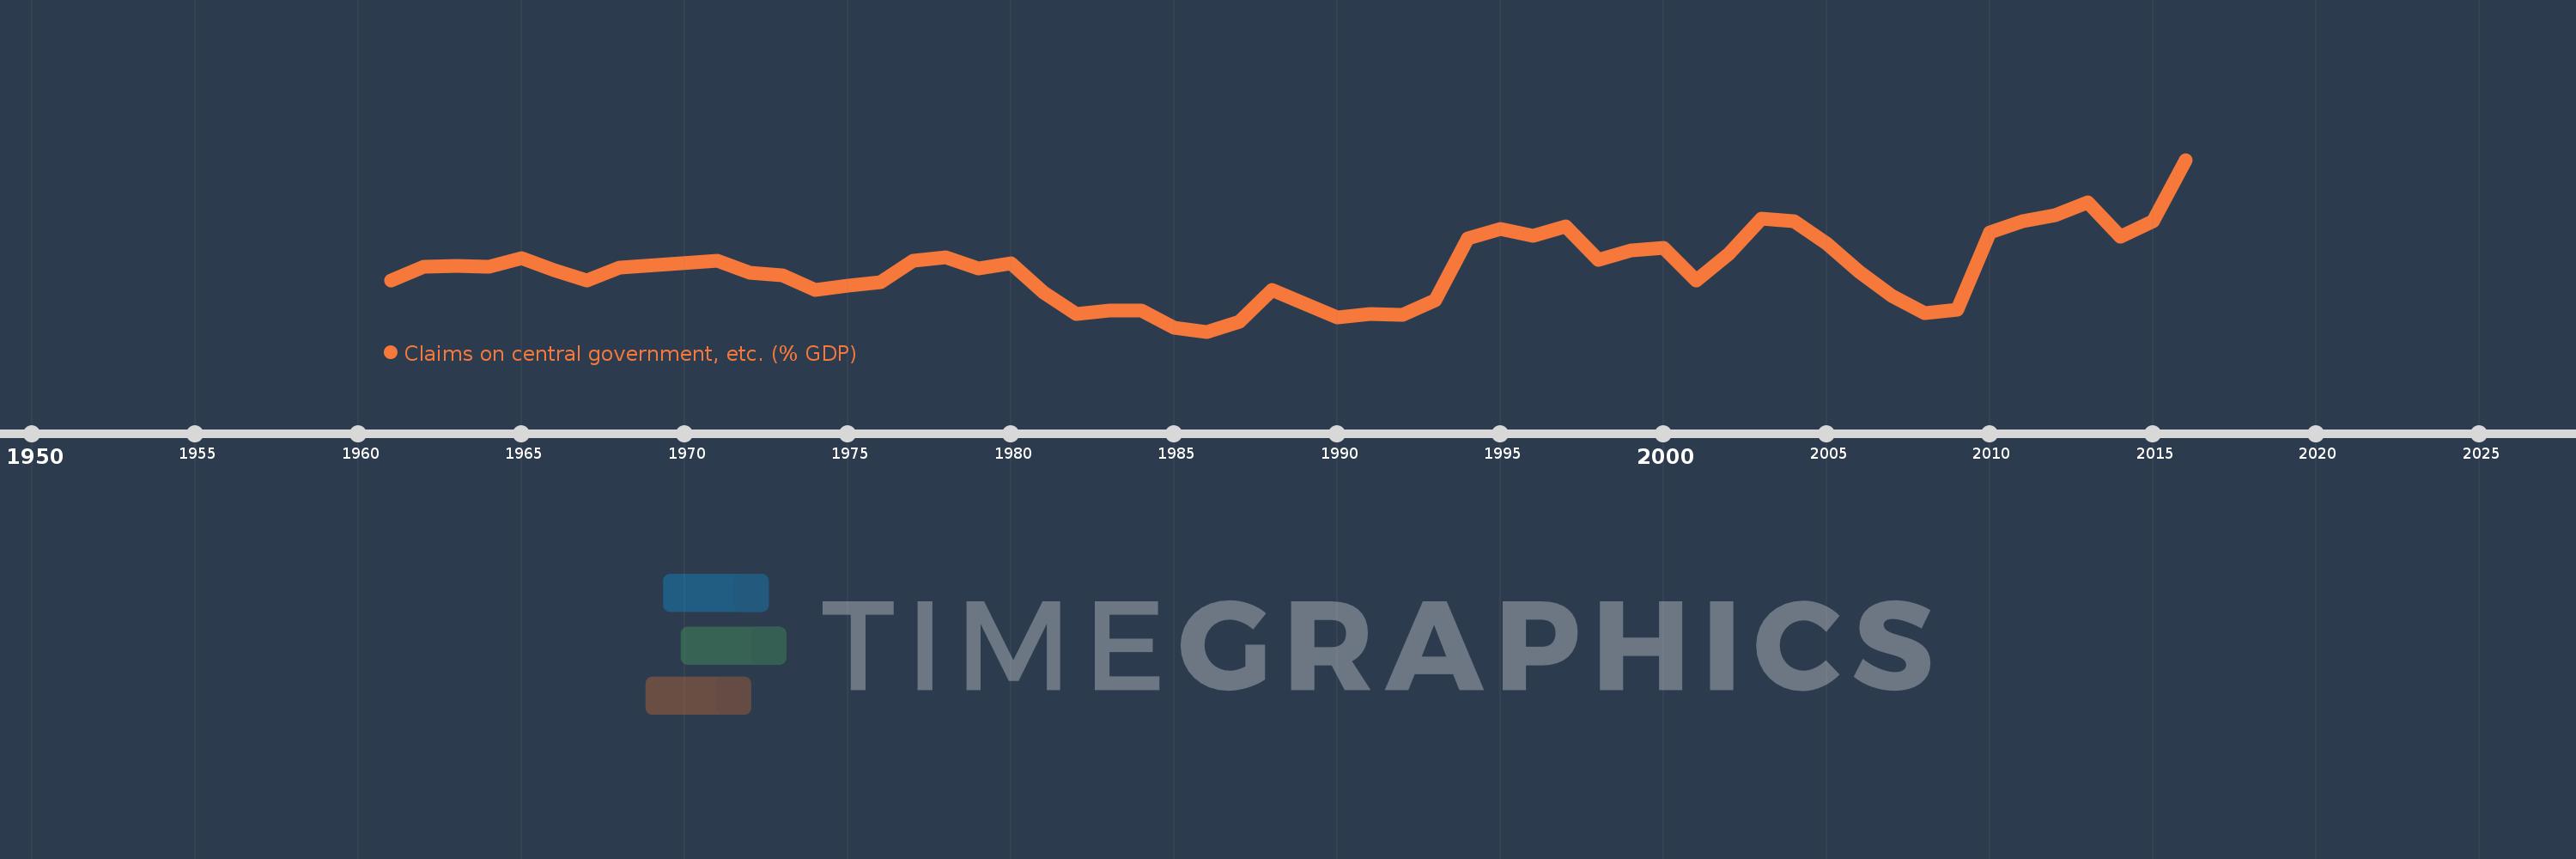
Claims on central government, etc. (% GDP)
2016,2015,2014,2013,2012,2011,2010,2009,2008,2007,2006,2005,2004,2003,2002,2001,2000,1999,1998,1997,1996,1995,1994,1993,1992,1991,1990,1989,1988,1987,1986,1985,1984,1983,1982,1981,1980,1979,1978,1977,1976,1975,1974,1973,1972,1971,1968,1967,1966,1965,1964,1963,1962,1961
This statistics in other country:
AfghanistanAlbaniaAlgeriaAngolaAntigua and BarbudaArab WorldArgentinaArmeniaArubaAustraliaAustriaAzerbaijanBahamas, TheBahrainBangladeshBarbadosBelarusBelgiumBelizeBeninBhutanBoliviaBosnia and HerzegovinaBotswanaBrazilBrunei DarussalamBulgariaBurkina FasoBurundiCabo VerdeCambodiaCameroonCanadaCaribbean small statesCentral African RepublicCentral Europe and the BalticsChadChileChinaColombiaComorosCongo, Dem. Rep.Congo, Rep.Costa RicaCote d'IvoireCroatiaCyprusCzech RepublicDenmarkDjiboutiDominicaDominican RepublicEarly-demographic dividendEast Asia & PacificEast Asia & Pacific (excluding high income)East Asia & Pacific (IDA & IBRD countries)EcuadorEgypt, Arab Rep.El SalvadorEquatorial GuineaEritreaEstoniaEthiopiaEuro areaEurope & Central AsiaEurope & Central Asia (excluding high income)Europe & Central Asia (IDA & IBRD countries)European UnionFijiFinlandFragile and conflict affected situationsFranceGabonGambia, TheGeorgiaGermanyGhanaGreeceGrenadaGuatemalaGuineaGuinea-BissauGuyanaHaitiHeavily indebted poor countries (HIPC)High incomeHondurasHong Kong SAR, ChinaHungaryIBRD onlyIcelandIDA & IBRD totalIDA blendIDA onlyIDA totalIndiaIndonesiaIran, Islamic Rep.IraqIrelandIsraelItalyJamaicaJapanJordanKazakhstanKenyaKorea, Rep.KosovoKuwaitKyrgyz RepublicLao PDRLate-demographic dividendLatin America & Caribbean Latin America & Caribbean (excluding high income)Latin America & the Caribbean (IDA & IBRD countries)LatviaLeast developed countries: UN classificationLebanonLesothoLiberiaLibyaLithuaniaLow & middle incomeLow incomeLower middle incomeLuxembourgMacao SAR, ChinaMacedonia, FYRMadagascarMalawiMalaysiaMaldivesMaliMaltaMauritaniaMauritiusMexicoMicronesia, Fed. Sts.Middle East & North AfricaMiddle East & North Africa (excluding high income)Middle East & North Africa (IDA & IBRD countries)Middle incomeMoldovaMongoliaMontenegroMoroccoMozambiqueMyanmarNamibiaNepalNetherlandsNew ZealandNicaraguaNigerNigeriaNorth AmericaNorwayOECD membersOmanOther small statesPacific island small statesPakistanPanamaPapua New GuineaParaguayPeruPhilippinesPolandPortugalPost-demographic dividendPre-demographic dividendQatarRomaniaRussian FederationRwandaSamoaSao Tome and PrincipeSaudi ArabiaSenegalSerbiaSeychellesSierra LeoneSingaporeSlovak RepublicSloveniaSmall statesSolomon IslandsSouth AfricaSouth AsiaSouth Asia (IDA & IBRD)South SudanSpainSri LankaSt. Kitts and NevisSt. LuciaSt. Vincent and the GrenadinesSub-Saharan Africa Sub-Saharan Africa (excluding high income)Sub-Saharan Africa (IDA & IBRD countries)SudanSurinameSwazilandSwedenSwitzerlandSyrian Arab RepublicTajikistanTanzaniaThailandTimor-LesteTogoTongaTrinidad and TobagoTunisiaTurkeyUgandaUkraineUnited Arab EmiratesUnited KingdomUnited StatesUpper middle incomeUruguayVanuatuVenezuela, RBVietnamWest Bank and GazaWorldYemen, Rep.ZambiaZimbabwe Timeline:
This timeline shows a graph from 1961 to 2016 of Other small states. No data until 1960. Number of actual observations by date: 54.
Source name:
World Development Indicators
Source organization:
International Monetary Fund, International Financial Statistics and data files, and World Bank and OECD GDP estimates.
Categories, topics:
Financial Sector
Last updated:
apr 23, 2017
Indicators value changes by year
Minimum:
-5.112
jan 1, 1986
Maximum:
12.206
jan 1, 2016
At the date of observation
Value
Absolute change
Change from previous value
jan 1, 1961
0.083
+0.083
0.0%
jan 1, 1962
1.437
+1.354
1.62K%
jan 1, 1963
1.507
+0.07
4.87%
jan 1, 1964
1.416
-0.092
-6.09%
jan 1, 1965
2.287
+0.872
61.57%
jan 1, 1966
1.037
-1.25
-54.64%
jan 1, 1967
-0.001
-1.038
-100.08%
jan 1, 1968
1.314
+1.315
-150.22K%
jan 1, 1971
2.002
+0.688
52.36%
jan 1, 1972
0.809
-1.194
-59.61%
jan 1, 1973
0.561
-0.248
-30.61%
jan 1, 1974
-0.924
-1.485
-264.58%
jan 1, 1975
-0.511
+0.412
-44.64%
jan 1, 1976
-0.143
+0.368
-72.06%
jan 1, 1977
2.06
+2.203
-1.54K%
jan 1, 1978
2.413
+0.353
17.11%
jan 1, 1979
1.265
-1.147
-47.56%
jan 1, 1980
1.762
+0.497
39.27%
jan 1, 1981
-1.131
-2.894
-164.21%
jan 1, 1982
-3.296
-2.165
191.34%
jan 1, 1983
-3.023
+0.274
-8.3%
jan 1, 1984
-3.027
-0.004
0.15%
jan 1, 1985
-4.696
-1.669
55.15%
jan 1, 1986
-5.112
-0.415
8.85%
jan 1, 1987
-4.086
+1.026
-20.06%
jan 1, 1988
-0.891
+3.195
-78.19%
jan 1, 1989
-2.299
-1.408
157.91%
jan 1, 1990
-3.662
-1.363
59.27%
jan 1, 1991
-3.306
+0.356
-9.71%
jan 1, 1992
-3.428
-0.122
3.69%
jan 1, 1993
-1.944
+1.484
-43.29%
jan 1, 1994
4.309
+6.253
-321.65%
jan 1, 1995
5.245
+0.936
21.72%
jan 1, 1996
4.541
-0.704
-13.43%
jan 1, 1997
5.482
+0.941
20.72%
jan 1, 1998
2.131
-3.35
-61.12%
jan 1, 1999
3.096
+0.965
45.29%
jan 1, 2000
3.295
+0.198
6.41%
jan 1, 2001
0.031
-3.264
-99.06%
jan 1, 2002
2.741
+2.71
8.73K%
jan 1, 2003
6.304
+3.563
129.98%
jan 1, 2004
5.977
-0.327
-5.19%
jan 1, 2005
3.802
-2.175
-36.38%
jan 1, 2006
0.944
-2.859
-75.18%
jan 1, 2007
-1.482
-2.426
-257.07%
jan 1, 2008
-3.274
-1.792
120.94%
jan 1, 2009
-2.922
+0.352
-10.75%
jan 1, 2010
4.858
+7.78
-266.23%
jan 1, 2011
6.003
+1.145
23.56%
jan 1, 2012
6.657
+0.654
10.9%
jan 1, 2013
7.935
+1.278
19.2%
jan 1, 2014
4.469
-3.466
-43.67%
jan 1, 2015
5.976
+1.507
33.72%
jan 1, 2016
12.206
+6.23
104.25%
Ranking of countries by current statistics by years


Comments: