29
/
en
AIzaSyAYiBZKx7MnpbEhh9jyipgxe19OcubqV5w
April 1, 2024
162300
Jamaica
JAM
true
2
1
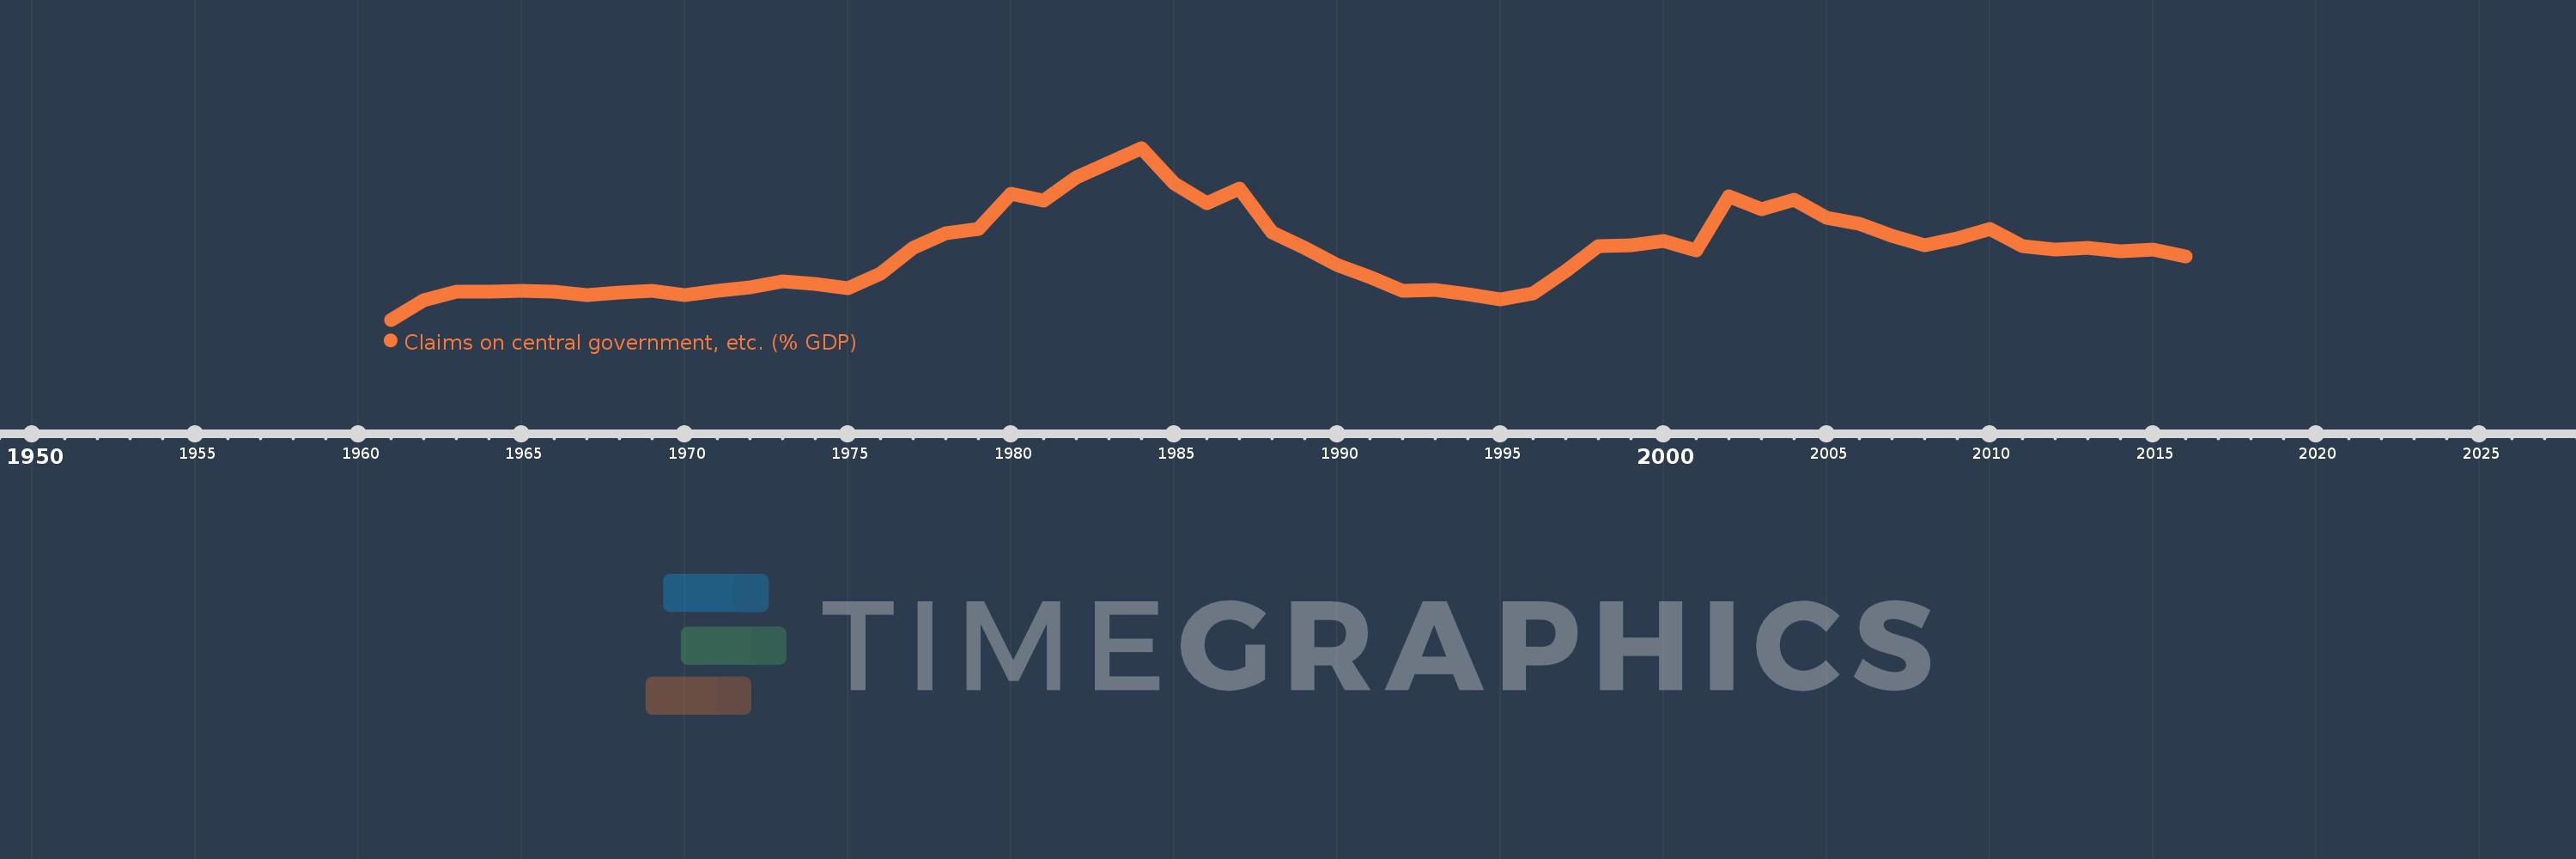
Claims on central government, etc. (% GDP)
2016,2015,2014,2013,2012,2011,2010,2009,2008,2007,2006,2005,2004,2003,2002,2001,2000,1999,1998,1997,1996,1995,1994,1993,1992,1991,1990,1989,1988,1987,1986,1985,1984,1983,1982,1981,1980,1979,1978,1977,1976,1975,1974,1973,1972,1971,1970,1969,1968,1967,1966,1965,1964,1963,1962,1961
This statistics in other country:
AfghanistanAlbaniaAlgeriaAngolaAntigua and BarbudaArab WorldArgentinaArmeniaArubaAustraliaAustriaAzerbaijanBahamas, TheBahrainBangladeshBarbadosBelarusBelgiumBelizeBeninBhutanBoliviaBosnia and HerzegovinaBotswanaBrazilBrunei DarussalamBulgariaBurkina FasoBurundiCabo VerdeCambodiaCameroonCanadaCaribbean small statesCentral African RepublicCentral Europe and the BalticsChadChileChinaColombiaComorosCongo, Dem. Rep.Congo, Rep.Costa RicaCote d'IvoireCroatiaCyprusCzech RepublicDenmarkDjiboutiDominicaDominican RepublicEarly-demographic dividendEast Asia & PacificEast Asia & Pacific (excluding high income)East Asia & Pacific (IDA & IBRD countries)EcuadorEgypt, Arab Rep.El SalvadorEquatorial GuineaEritreaEstoniaEthiopiaEuro areaEurope & Central AsiaEurope & Central Asia (excluding high income)Europe & Central Asia (IDA & IBRD countries)European UnionFijiFinlandFragile and conflict affected situationsFranceGabonGambia, TheGeorgiaGermanyGhanaGreeceGrenadaGuatemalaGuineaGuinea-BissauGuyanaHaitiHeavily indebted poor countries (HIPC)High incomeHondurasHong Kong SAR, ChinaHungaryIBRD onlyIcelandIDA & IBRD totalIDA blendIDA onlyIDA totalIndiaIndonesiaIran, Islamic Rep.IraqIrelandIsraelItalyJamaicaJapanJordanKazakhstanKenyaKorea, Rep.KosovoKuwaitKyrgyz RepublicLao PDRLate-demographic dividendLatin America & Caribbean Latin America & Caribbean (excluding high income)Latin America & the Caribbean (IDA & IBRD countries)LatviaLeast developed countries: UN classificationLebanonLesothoLiberiaLibyaLithuaniaLow & middle incomeLow incomeLower middle incomeLuxembourgMacao SAR, ChinaMacedonia, FYRMadagascarMalawiMalaysiaMaldivesMaliMaltaMauritaniaMauritiusMexicoMicronesia, Fed. Sts.Middle East & North AfricaMiddle East & North Africa (excluding high income)Middle East & North Africa (IDA & IBRD countries)Middle incomeMoldovaMongoliaMontenegroMoroccoMozambiqueMyanmarNamibiaNepalNetherlandsNew ZealandNicaraguaNigerNigeriaNorth AmericaNorwayOECD membersOmanOther small statesPacific island small statesPakistanPanamaPapua New GuineaParaguayPeruPhilippinesPolandPortugalPost-demographic dividendPre-demographic dividendQatarRomaniaRussian FederationRwandaSamoaSao Tome and PrincipeSaudi ArabiaSenegalSerbiaSeychellesSierra LeoneSingaporeSlovak RepublicSloveniaSmall statesSolomon IslandsSouth AfricaSouth AsiaSouth Asia (IDA & IBRD)South SudanSpainSri LankaSt. Kitts and NevisSt. LuciaSt. Vincent and the GrenadinesSub-Saharan Africa Sub-Saharan Africa (excluding high income)Sub-Saharan Africa (IDA & IBRD countries)SudanSurinameSwazilandSwedenSwitzerlandSyrian Arab RepublicTajikistanTanzaniaThailandTimor-LesteTogoTongaTrinidad and TobagoTunisiaTurkeyUgandaUkraineUnited Arab EmiratesUnited KingdomUnited StatesUpper middle incomeUruguayVanuatuVenezuela, RBVietnamWest Bank and GazaWorldYemen, Rep.ZambiaZimbabwe Timeline:
This timeline shows a graph from 1961 to 2016 of Jamaica. No data until 1960. Number of actual observations by date: 56.
Source name:
World Development Indicators
Source organization:
International Monetary Fund, International Financial Statistics and data files, and World Bank and OECD GDP estimates.
Categories, topics:
Financial Sector
Last updated:
apr 23, 2017
Indicators value changes by year
Minimum:
-6.288
jan 1, 1961
Maximum:
53.253
jan 1, 1984
At the date of observation
Value
Absolute change
Change from previous value
jan 1, 1961
-6.288
-6.288
0.0%
jan 1, 1962
0.35
+6.638
-105.56%
jan 1, 1963
3.41
+3.061
875.48%
jan 1, 1964
3.469
+0.059
1.73%
jan 1, 1965
3.694
+0.225
6.48%
jan 1, 1966
3.415
-0.279
-7.56%
jan 1, 1967
2.201
-1.215
-35.56%
jan 1, 1968
3.083
+0.883
40.12%
jan 1, 1969
3.638
+0.554
17.97%
jan 1, 1970
2.347
-1.29
-35.47%
jan 1, 1971
3.721
+1.374
58.53%
jan 1, 1972
4.884
+1.162
31.23%
jan 1, 1973
7.113
+2.23
45.66%
jan 1, 1974
6.234
-0.879
-12.36%
jan 1, 1975
4.625
-1.609
-25.82%
jan 1, 1976
9.765
+5.14
111.15%
jan 1, 1977
18.586
+8.821
90.33%
jan 1, 1978
23.775
+5.19
27.92%
jan 1, 1979
25.139
+1.364
5.74%
jan 1, 1980
37.525
+12.386
49.27%
jan 1, 1981
35.139
-2.385
-6.36%
jan 1, 1982
43.012
+7.872
22.4%
jan 1, 1983
47.954
+4.943
11.49%
jan 1, 1984
53.253
+5.299
11.05%
jan 1, 1985
41.039
-12.214
-22.94%
jan 1, 1986
34.191
-6.848
-16.69%
jan 1, 1987
39.176
+4.986
14.58%
jan 1, 1988
23.89
-15.287
-39.02%
jan 1, 1989
18.567
-5.323
-22.28%
jan 1, 1990
12.769
-5.798
-31.23%
jan 1, 1991
8.647
-4.122
-32.28%
jan 1, 1992
3.712
-4.934
-57.07%
jan 1, 1993
4.11
+0.398
10.72%
jan 1, 1994
2.672
-1.438
-34.99%
jan 1, 1995
0.771
-1.901
-71.14%
jan 1, 1996
2.943
+2.172
281.63%
jan 1, 1997
10.72
+7.777
264.25%
jan 1, 1998
19.146
+8.426
78.61%
jan 1, 1999
19.463
+0.317
1.66%
jan 1, 2000
21.063
+1.6
8.22%
jan 1, 2001
17.86
-3.203
-15.21%
jan 1, 2002
36.462
+18.603
104.16%
jan 1, 2003
32.046
-4.417
-12.11%
jan 1, 2004
35.356
+3.31
10.33%
jan 1, 2005
29.056
-6.3
-17.82%
jan 1, 2006
26.963
-2.094
-7.21%
jan 1, 2007
22.661
-4.301
-15.95%
jan 1, 2008
19.405
-3.256
-14.37%
jan 1, 2009
21.945
+2.539
13.09%
jan 1, 2010
25.3
+3.355
15.29%
jan 1, 2011
19.337
-5.963
-23.57%
jan 1, 2012
18.077
-1.26
-6.52%
jan 1, 2013
18.601
+0.524
2.9%
jan 1, 2014
17.545
-1.056
-5.68%
jan 1, 2015
18.025
+0.48
2.74%
jan 1, 2016
15.672
-2.353
-13.05%
Ranking of countries by current statistics by years


Comments: