29
/
en
AIzaSyAYiBZKx7MnpbEhh9jyipgxe19OcubqV5w
April 1, 2024
167210
Kenya
KEN
true
2
1
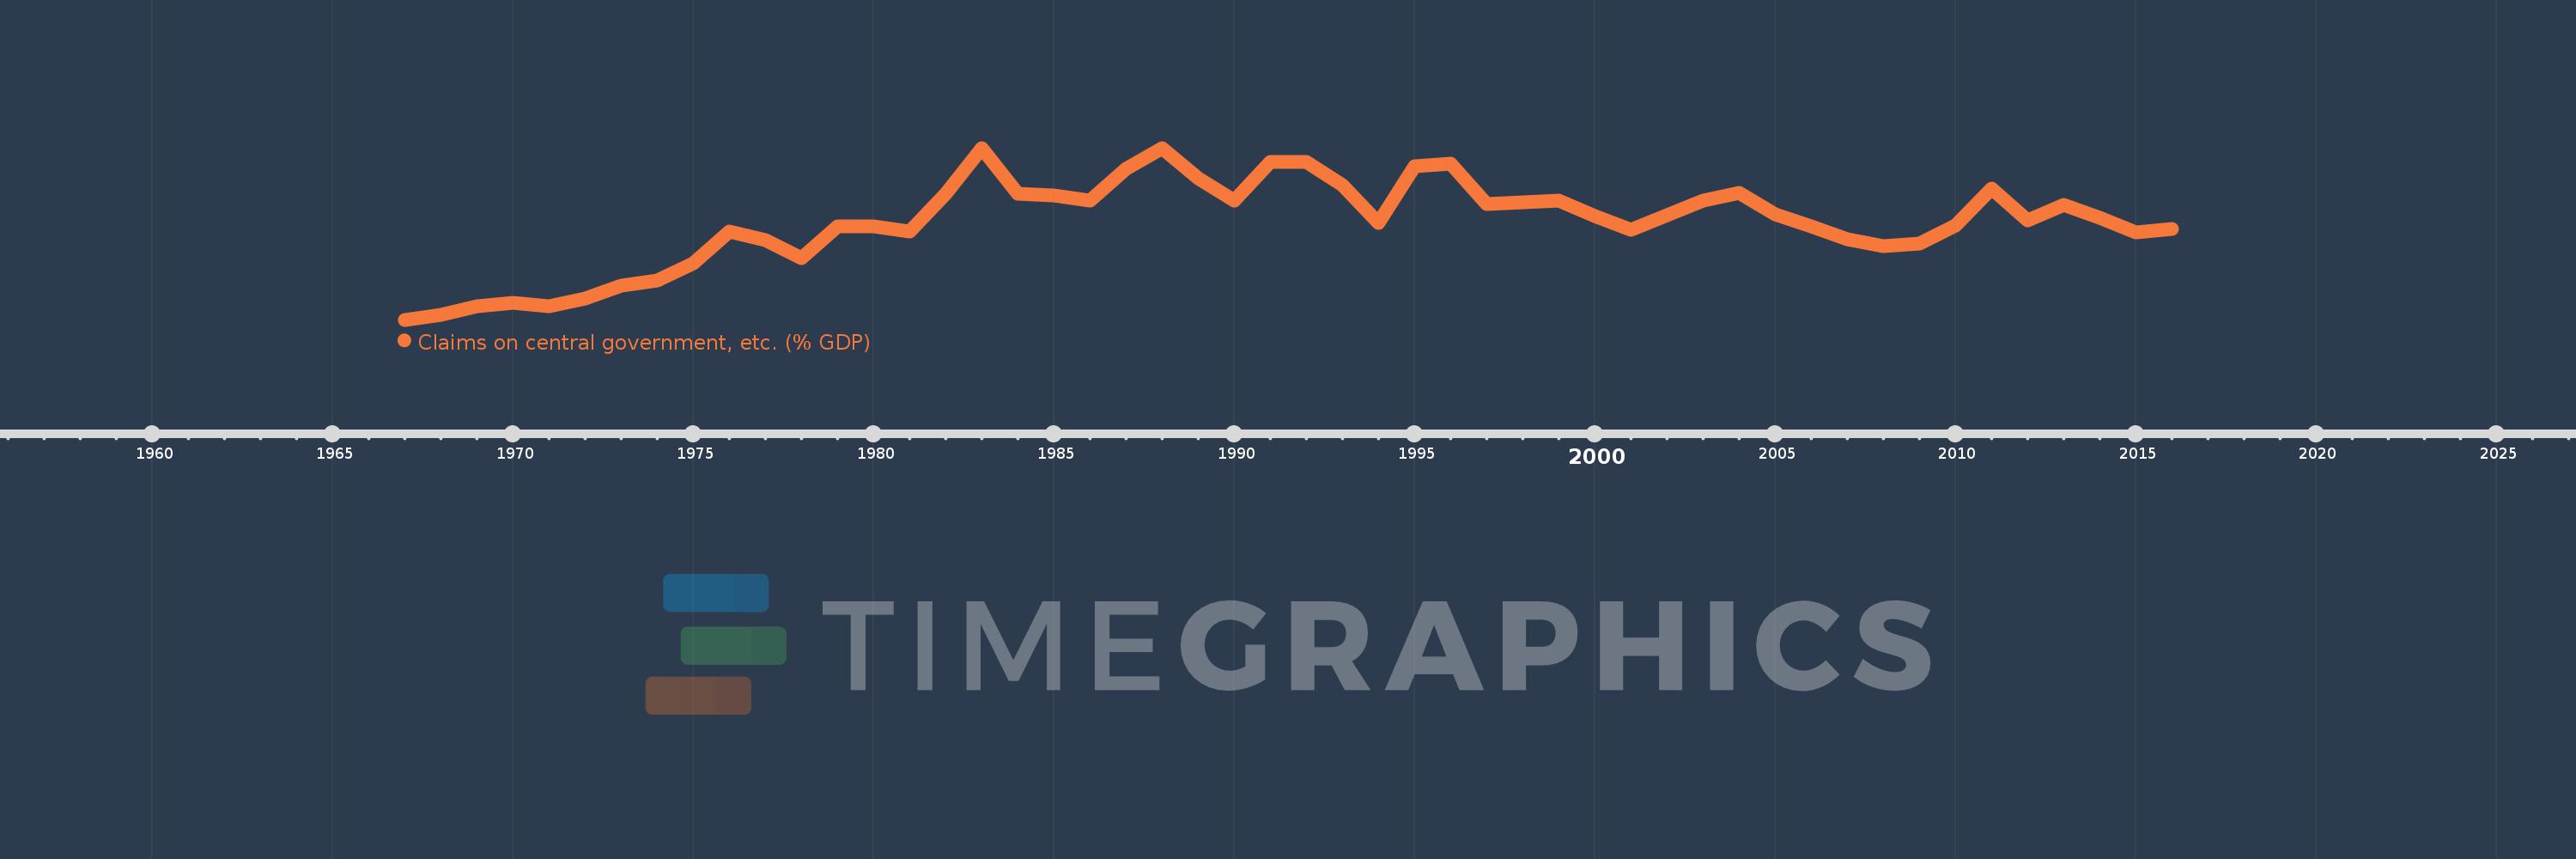
Claims on central government, etc. (% GDP)
2016,2015,2014,2013,2012,2011,2010,2009,2008,2007,2006,2005,2004,2003,2002,2001,2000,1999,1998,1997,1996,1995,1994,1993,1992,1991,1990,1989,1988,1987,1986,1985,1984,1983,1982,1981,1980,1979,1978,1977,1976,1975,1974,1973,1972,1971,1970,1969,1968,1967
This statistics in other country:
AfghanistanAlbaniaAlgeriaAngolaAntigua and BarbudaArab WorldArgentinaArmeniaArubaAustraliaAustriaAzerbaijanBahamas, TheBahrainBangladeshBarbadosBelarusBelgiumBelizeBeninBhutanBoliviaBosnia and HerzegovinaBotswanaBrazilBrunei DarussalamBulgariaBurkina FasoBurundiCabo VerdeCambodiaCameroonCanadaCaribbean small statesCentral African RepublicCentral Europe and the BalticsChadChileChinaColombiaComorosCongo, Dem. Rep.Congo, Rep.Costa RicaCote d'IvoireCroatiaCyprusCzech RepublicDenmarkDjiboutiDominicaDominican RepublicEarly-demographic dividendEast Asia & PacificEast Asia & Pacific (excluding high income)East Asia & Pacific (IDA & IBRD countries)EcuadorEgypt, Arab Rep.El SalvadorEquatorial GuineaEritreaEstoniaEthiopiaEuro areaEurope & Central AsiaEurope & Central Asia (excluding high income)Europe & Central Asia (IDA & IBRD countries)European UnionFijiFinlandFragile and conflict affected situationsFranceGabonGambia, TheGeorgiaGermanyGhanaGreeceGrenadaGuatemalaGuineaGuinea-BissauGuyanaHaitiHeavily indebted poor countries (HIPC)High incomeHondurasHong Kong SAR, ChinaHungaryIBRD onlyIcelandIDA & IBRD totalIDA blendIDA onlyIDA totalIndiaIndonesiaIran, Islamic Rep.IraqIrelandIsraelItalyJamaicaJapanJordanKazakhstanKenyaKorea, Rep.KosovoKuwaitKyrgyz RepublicLao PDRLate-demographic dividendLatin America & Caribbean Latin America & Caribbean (excluding high income)Latin America & the Caribbean (IDA & IBRD countries)LatviaLeast developed countries: UN classificationLebanonLesothoLiberiaLibyaLithuaniaLow & middle incomeLow incomeLower middle incomeLuxembourgMacao SAR, ChinaMacedonia, FYRMadagascarMalawiMalaysiaMaldivesMaliMaltaMauritaniaMauritiusMexicoMicronesia, Fed. Sts.Middle East & North AfricaMiddle East & North Africa (excluding high income)Middle East & North Africa (IDA & IBRD countries)Middle incomeMoldovaMongoliaMontenegroMoroccoMozambiqueMyanmarNamibiaNepalNetherlandsNew ZealandNicaraguaNigerNigeriaNorth AmericaNorwayOECD membersOmanOther small statesPacific island small statesPakistanPanamaPapua New GuineaParaguayPeruPhilippinesPolandPortugalPost-demographic dividendPre-demographic dividendQatarRomaniaRussian FederationRwandaSamoaSao Tome and PrincipeSaudi ArabiaSenegalSerbiaSeychellesSierra LeoneSingaporeSlovak RepublicSloveniaSmall statesSolomon IslandsSouth AfricaSouth AsiaSouth Asia (IDA & IBRD)South SudanSpainSri LankaSt. Kitts and NevisSt. LuciaSt. Vincent and the GrenadinesSub-Saharan Africa Sub-Saharan Africa (excluding high income)Sub-Saharan Africa (IDA & IBRD countries)SudanSurinameSwazilandSwedenSwitzerlandSyrian Arab RepublicTajikistanTanzaniaThailandTimor-LesteTogoTongaTrinidad and TobagoTunisiaTurkeyUgandaUkraineUnited Arab EmiratesUnited KingdomUnited StatesUpper middle incomeUruguayVanuatuVenezuela, RBVietnamWest Bank and GazaWorldYemen, Rep.ZambiaZimbabwe Timeline:
This timeline shows a graph from 1967 to 2016 of Kenya. No data until 1966. Number of actual observations by date: 50.
Source name:
World Development Indicators
Source organization:
International Monetary Fund, International Financial Statistics and data files, and World Bank and OECD GDP estimates.
Categories, topics:
Financial Sector
Last updated:
apr 23, 2017
Indicators value changes by year
Maximum:
15.236
jan 1, 1983
At the date of observation
Value
Absolute change
Change from previous value
jan 1, 1967
-0.95
-0.95
0.0%
jan 1, 1968
-0.522
+0.427
-45.0%
jan 1, 1969
0.341
+0.863
-165.27%
jan 1, 1970
0.674
+0.333
97.65%
jan 1, 1971
0.339
-0.335
-49.72%
jan 1, 1972
1.047
+0.708
209.02%
jan 1, 1973
2.302
+1.255
119.82%
jan 1, 1974
2.735
+0.433
18.82%
jan 1, 1975
4.381
+1.646
60.19%
jan 1, 1976
7.375
+2.993
68.32%
jan 1, 1977
6.53
-0.844
-11.45%
jan 1, 1978
4.836
-1.694
-25.94%
jan 1, 1979
7.867
+3.031
62.67%
jan 1, 1980
7.823
-0.044
-0.56%
jan 1, 1981
7.344
-0.479
-6.13%
jan 1, 1982
10.922
+3.578
48.72%
jan 1, 1983
15.236
+4.315
39.51%
jan 1, 1984
10.943
-4.293
-28.18%
jan 1, 1985
10.722
-0.221
-2.02%
jan 1, 1986
10.279
-0.443
-4.13%
jan 1, 1987
13.24
+2.961
28.8%
jan 1, 1988
15.182
+1.942
14.67%
jan 1, 1989
12.392
-2.79
-18.38%
jan 1, 1990
10.265
-2.127
-17.16%
jan 1, 1991
13.955
+3.69
35.95%
jan 1, 1992
13.887
-0.068
-0.49%
jan 1, 1993
11.724
-2.163
-15.57%
jan 1, 1994
8.193
-3.531
-30.12%
jan 1, 1995
13.497
+5.304
64.74%
jan 1, 1996
13.766
+0.27
2.0%
jan 1, 1997
9.984
-3.782
-27.47%
jan 1, 1998
10.139
+0.154
1.55%
jan 1, 1999
10.269
+0.13
1.28%
jan 1, 2000
8.795
-1.474
-14.35%
jan 1, 2001
7.546
-1.249
-14.2%
jan 1, 2002
8.924
+1.377
18.25%
jan 1, 2003
10.26
+1.336
14.97%
jan 1, 2004
11.01
+0.75
7.31%
jan 1, 2005
8.997
-2.013
-18.28%
jan 1, 2006
7.874
-1.123
-12.48%
jan 1, 2007
6.659
-1.215
-15.43%
jan 1, 2008
6.005
-0.654
-9.82%
jan 1, 2009
6.217
+0.211
3.52%
jan 1, 2010
7.966
+1.749
28.14%
jan 1, 2011
11.417
+3.45
43.31%
jan 1, 2012
8.445
-2.971
-26.03%
jan 1, 2013
9.853
+1.408
16.67%
jan 1, 2014
8.623
-1.23
-12.48%
jan 1, 2015
7.317
-1.306
-15.15%
jan 1, 2016
7.634
+0.317
4.33%
Ranking of countries by current statistics by years


Comments: